Use PandarView
1 Overview
PandarView2 is the official point cloud visualization and debugging tool provided by Hesai. It supports real-time visualization, recording and playback of lidar point clouds, data export and analysis, serial connection verification, and other functions. This tool is compatible with all series of Hesai lidar products.
2 Common Operation Instructions
2.1 Download and Installation
The latest version of the PandarView2 software and its User Manual can be downloaded from the Hesai official website. For information on system requirements (Windows, Ubuntu), hardware and driver configurations, supported lidar models and installation notes, please refer to the PandarView2 User Manual.
Note: On Ubuntu systems, the PandarView2 installation file is in .bin format. To install, navigate to the directory containing the .bin file and run the following commands:
sudo chmod +x PandarView_Release_Ubuntu_V2.1.7.bin # Replace with the actual version of the PandarView2 installation file
sudo ./PandarView_Release_Ubuntu_V2.1.7.bin
After successful installation, run the PandarView2 software using the following command in the installation directory:
Before using PandarView2 to display point clouds, ensure that:
- The lidar is functioning properly.
- The hardware setup is correct: connection box, Ethernet cable, power adapter.
- The PC can receive UDP data packets from the lidar (this can be verified using Wireshark).
2.2 Connect Devices and Parse Data
2.2.1 Startup and Connection
After starting PandarView2, click the second icon from the left in the toolbar (as shown in the figure below) to enter the data connection settings:

PandarView2 supports the following four methods to obtain point cloud data for playback:
- Listen Net: Real-time reception of point clouds via Ethernet port
- Serial Port: Real-time reception of point clouds via serial port (e.g., JT16)
- Pcap File: Read saved
.pcapfiles for offline playback - Listen Net From TCP: Receive point clouds via TCP interface
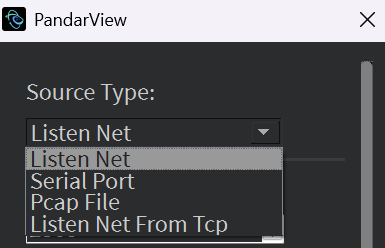
Taking "Listen Net" as an example, after completing the configuration as shown in the figure below, click OK, and PandarView2 will automatically try to establish a connection.
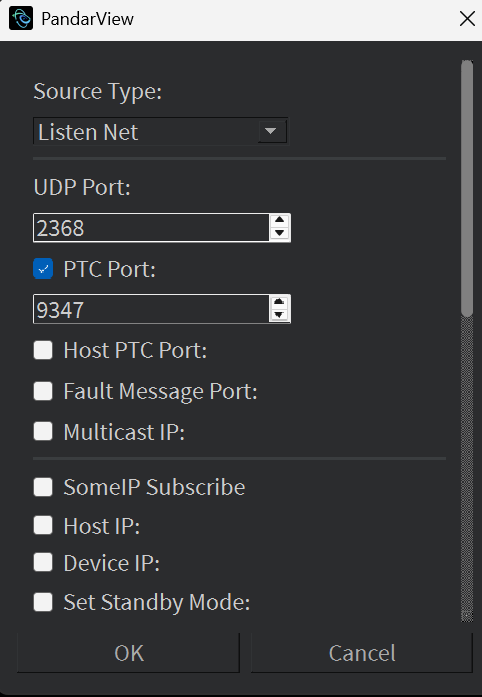
The meanings of the configuration parameters shown in the figure are described as follows:
| Parameter Name | Meaning |
|---|---|
| UDP Port | UDP port for lidar point cloud data packets |
| PTC Port | Control channel port, used for parameter configuration |
| Host PTC Port | TCP control port monitored by the local machine |
| Fault Message Port | UDP port for receiving lidar fault codes |
| Multicast IP | Multicast address that needs to be filled in when working in multicast mode |
| SomeIP Subscribe | Whether to enable SomeIP protocol subscription (used for communication with in-vehicle domain controllers) |
| Host IP | IP address of the host computer |
| Device IP | Fixed IP address of the lidar device |
| Set Standby Mode | Enter the lidar standby mode |
When connecting to the lidar, make sure the UDP port is correct. The UDP Port can be viewed using Wireshark:
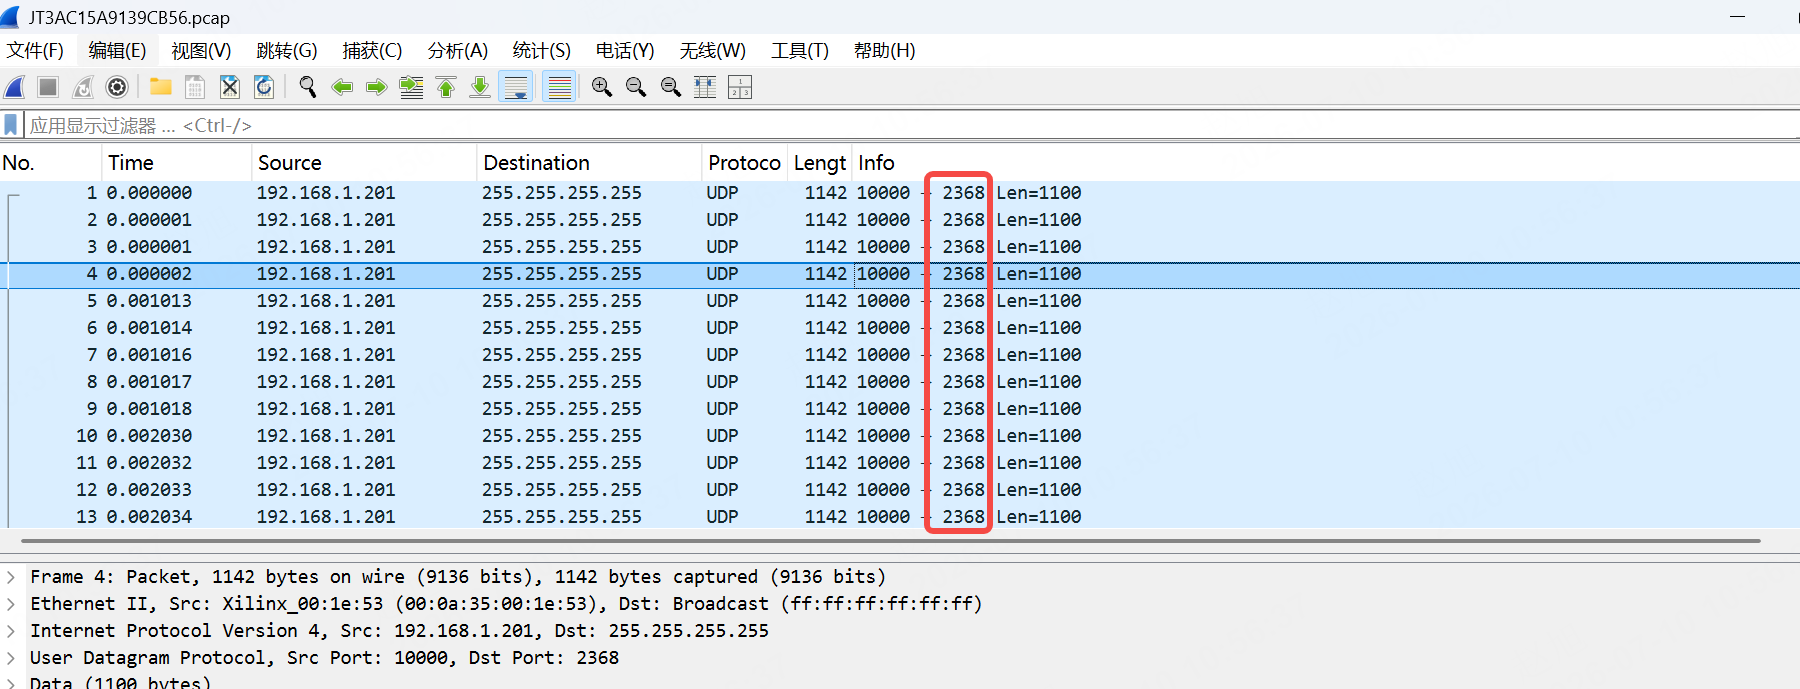
The IP address of the host must be in the same network segment as the IP address of the lidar, and the Device IP must be entered correctly. Wireshark can be used to view the IP address of the lidar:
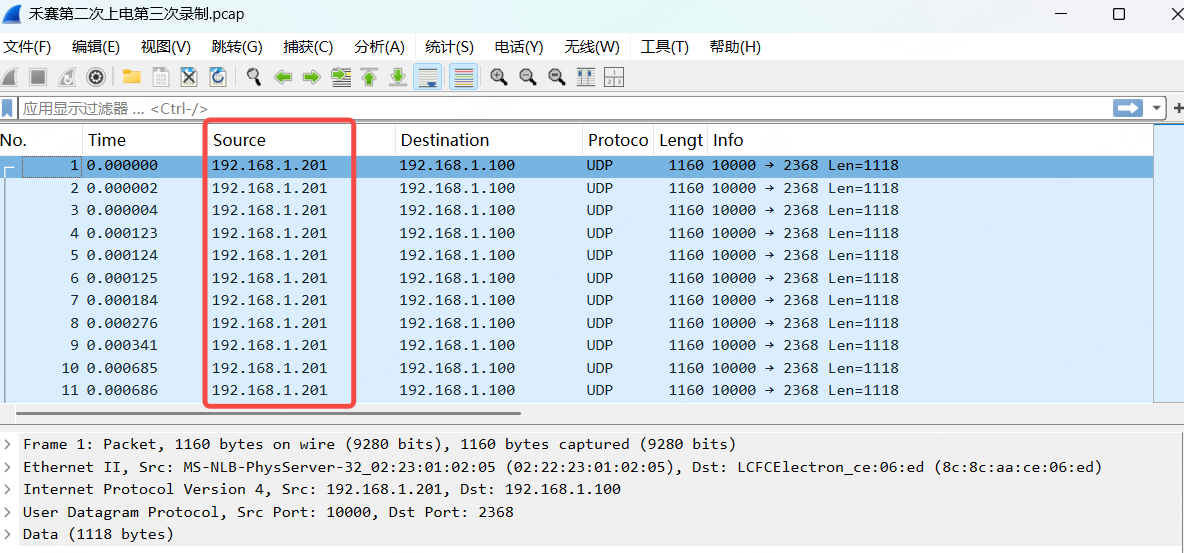
Once all the above conditions are met, user can connect to the lidar and view the point cloud successfully.
2.2.2 Replay PCAP Data
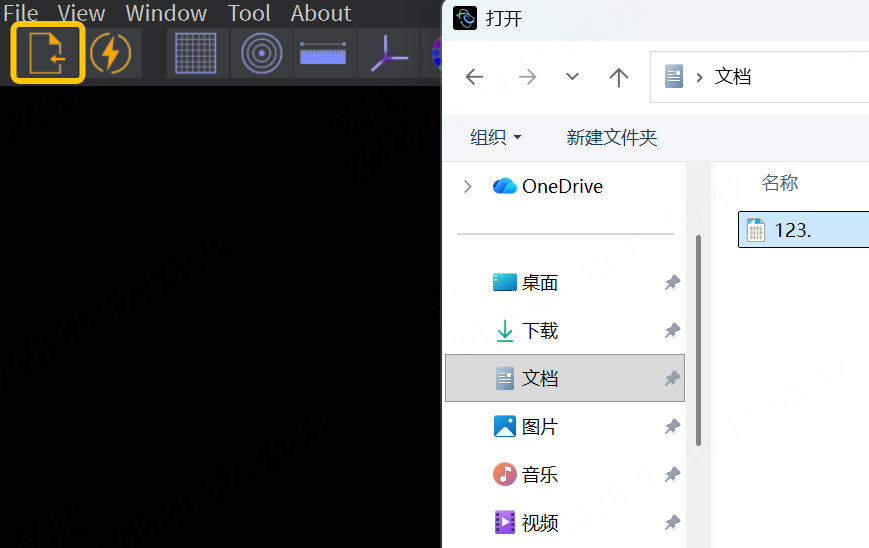
Method 1: Click the area marked in red, then select the corresponding pcap file and open it to view the point cloud:
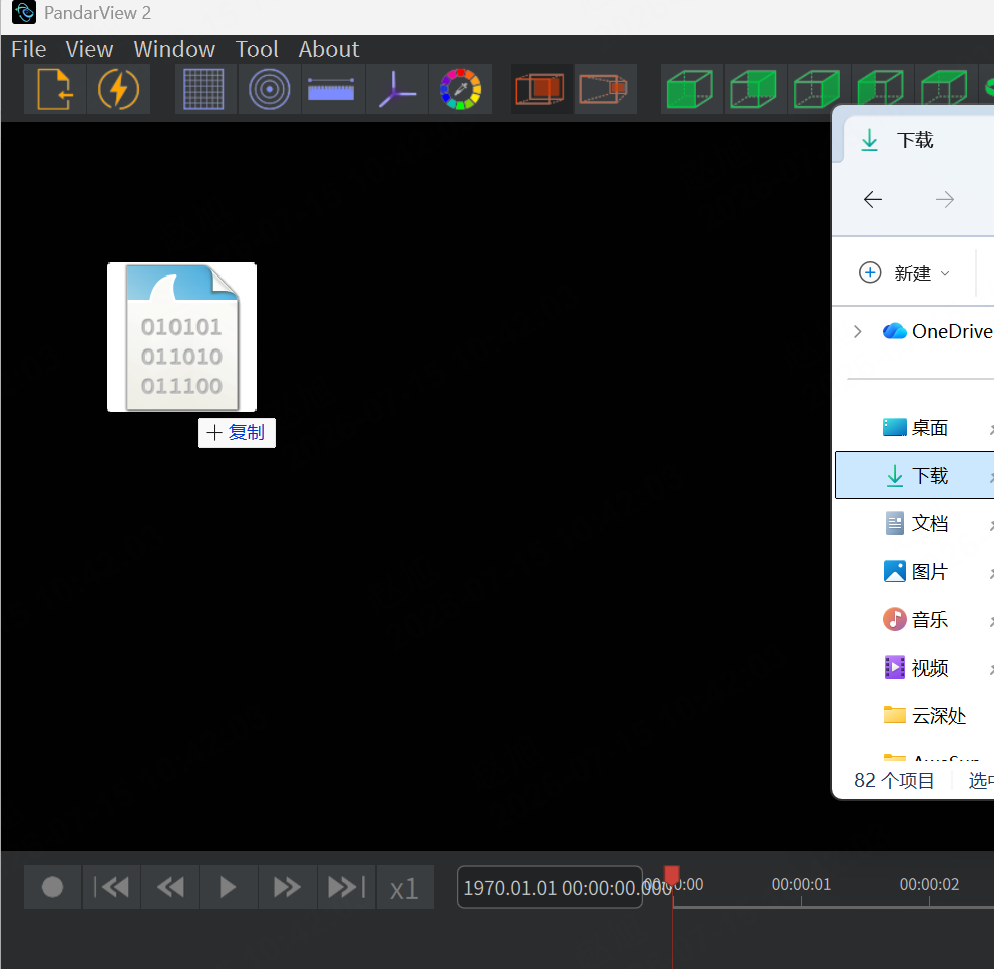
Method 2: Directly drag and drop the pcap file into PandarView:
2.3 Point Cloud Correction
As shown in the figure below, the third icon from the left in the PandarView2 toolbar is the point cloud correction option (Correction). It supports importing the corresponding correction file to enable point cloud correction during real-time point cloud playback or offline pcap file playback, or exporting the correction file built into the lidar during real-time point cloud playback.
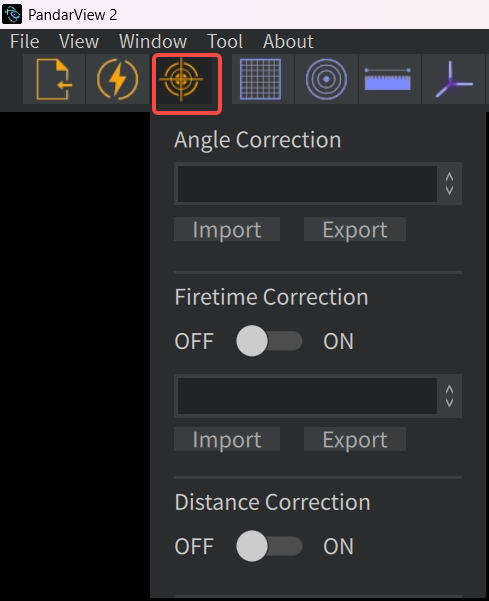
PandarView2 supports the following three different types of point cloud correction options:
- Angle Correction: Click Import to import the angle correction file of the lidar to achieve the correction effect.
- Firetime Correction: Click Import to import the firetime correction file of the lidar to achieve the correction effect.
- Distance Correction: Enable the switch of this correction option to achieve the correction effect. (Note: This option is used to correct the distance error caused by the mismatch between the lidar's emission center and geometric center)
2.4 Laser Channel Selection
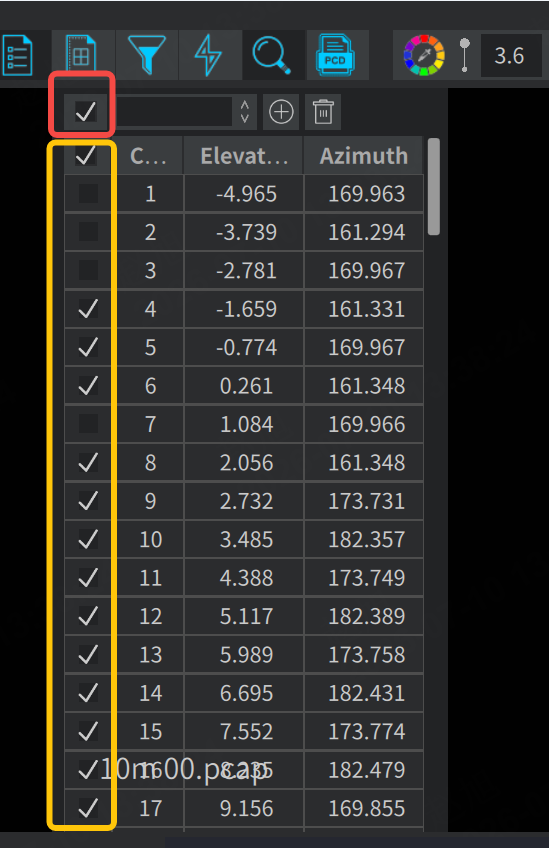
After clicking the highlighted icon (Channels) in the PandarView2 toolbar, user can view or modify the laser channels of the currently displayed point cloud and the corresponding angle parameters.
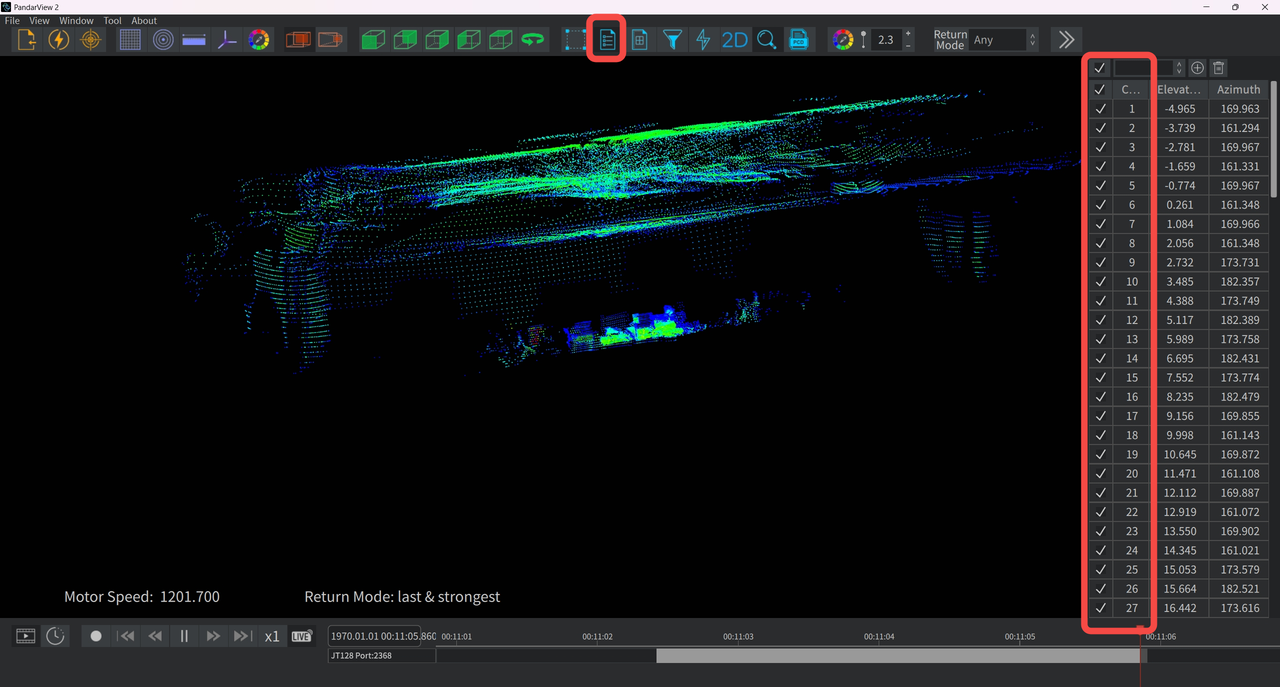
- Check the select-all button at the top, and all channel point clouds will be displayed after clicking; the buttons in the yellow box below allow the user to filter channels one by one. When a channel is not selected, the point cloud of that channel will not be displayed.
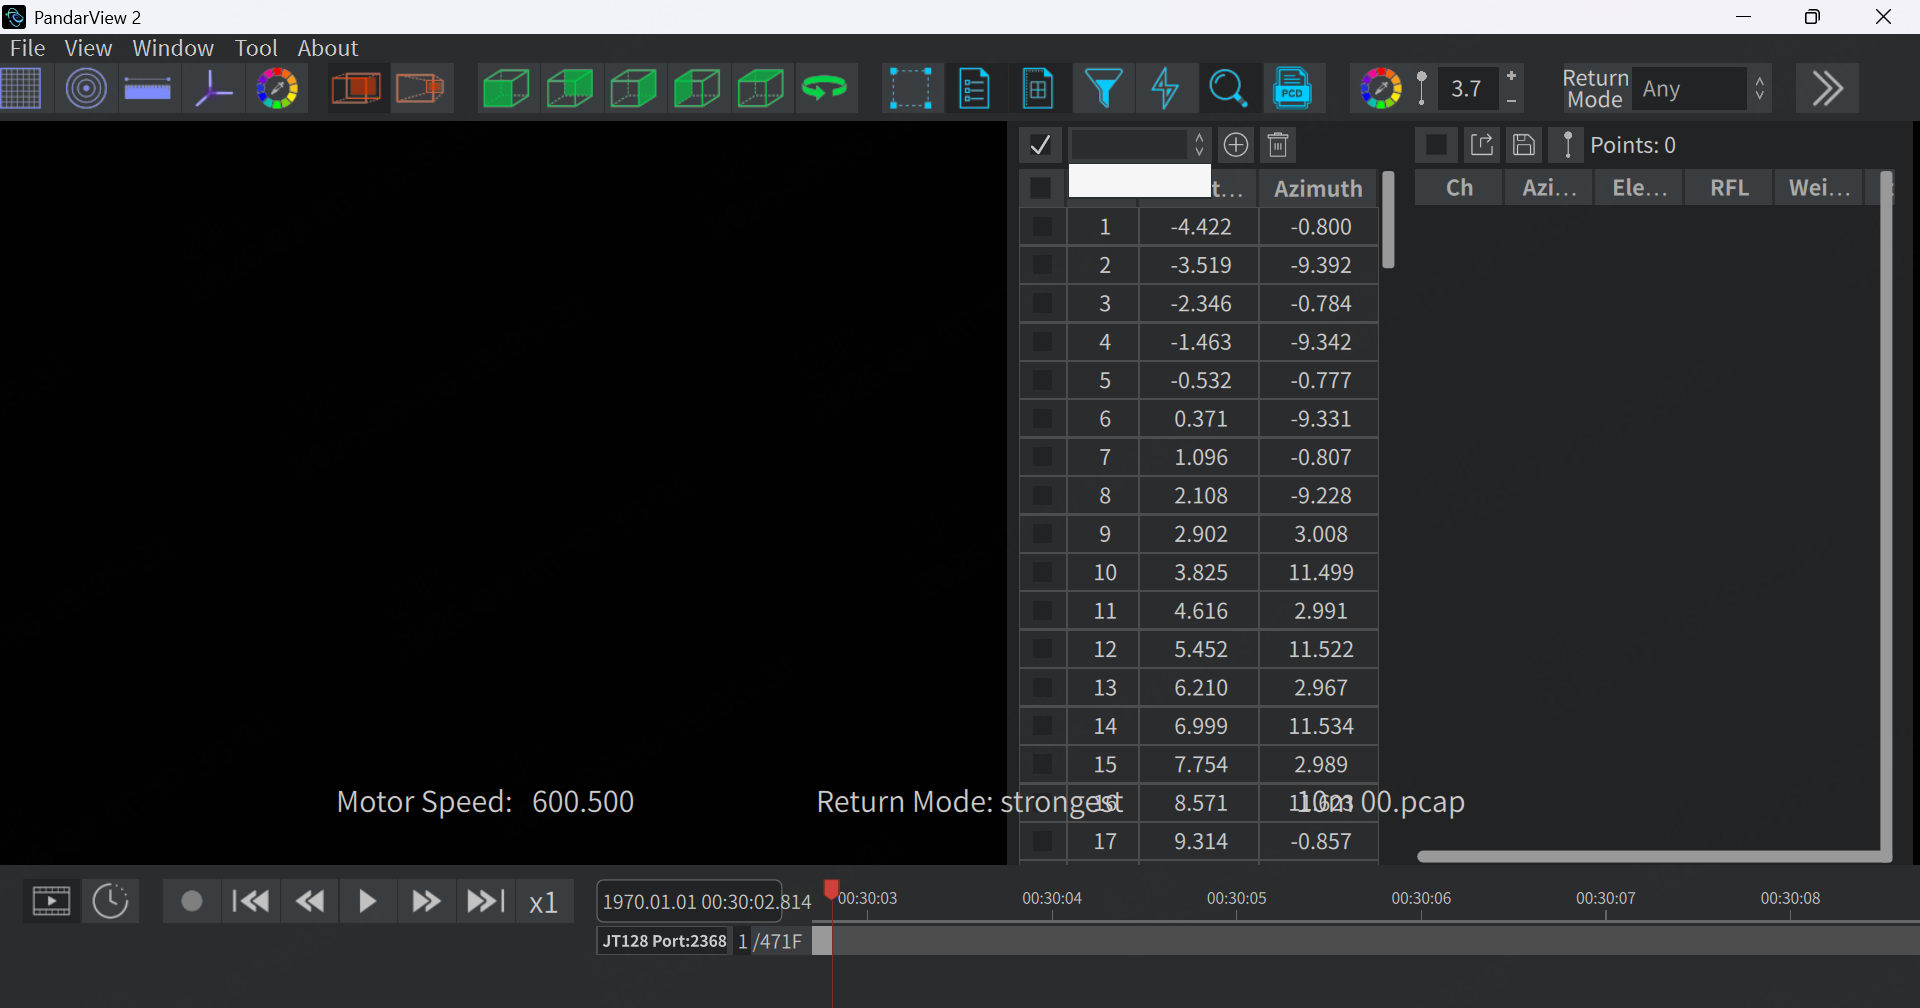
- If none of the channels are checked, the corresponding point cloud will disappear completely:
2.5 Point Cloud Data Selection and Data Table
As shown in the figure below, after clicking the highlighted left icon (Select) in the PandarView2 toolbar, user can drag the mouse in the current point cloud area to manually select and highlight a set of data points; after clicking the highlighted right icon (Spread Sheet) in the toolbar area shown in the figure, user can view all detailed data of the selected data points.
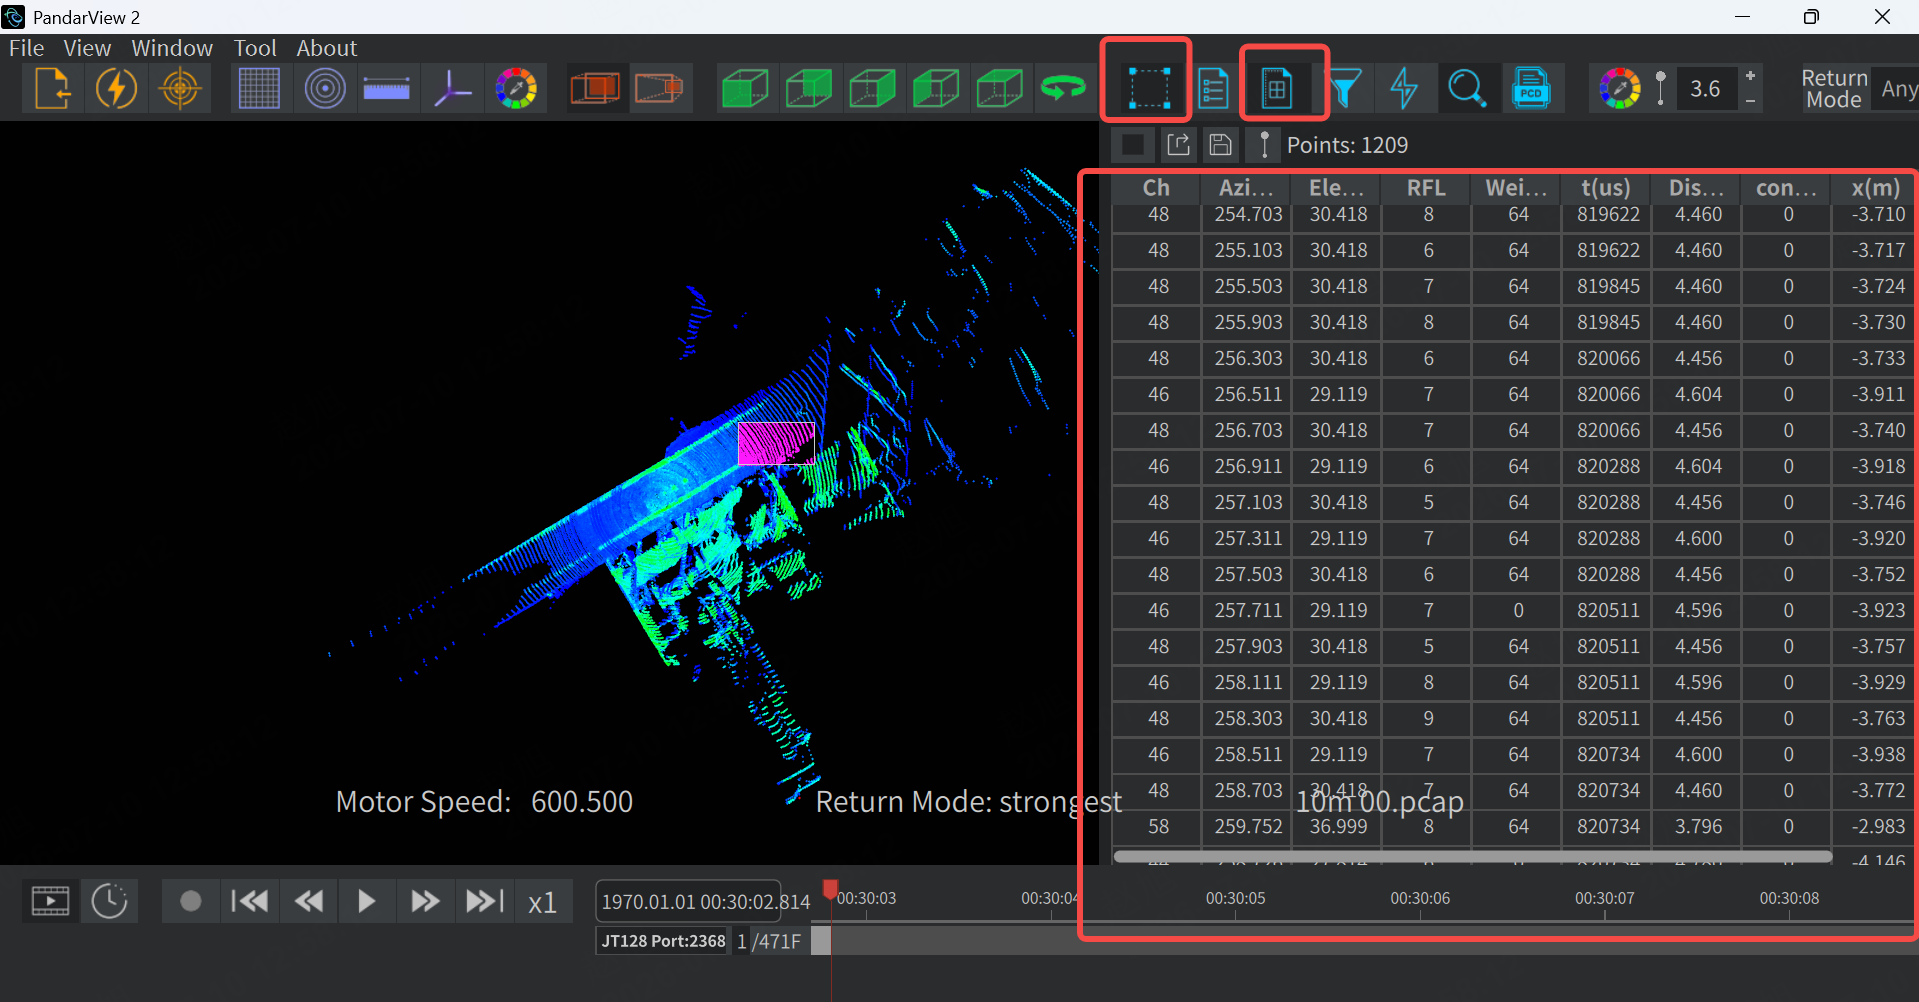
The function descriptions of the three small buttons from left to right highlighted at the top of the data table are as follows:
| Button Name | Function Description |
|---|---|
| Select All | Display detailed data of all data points in the current frame of point cloud. When clicked again, only detailed data of the selected data points will be displayed |
| Export Points Info | Export the current data table as a CSV file. When naming the file under Ubuntu system, the suffix (.csv) must be included |
| Save Column Order | Save the current column order |
- Click the button marked in the first red box to select all points.
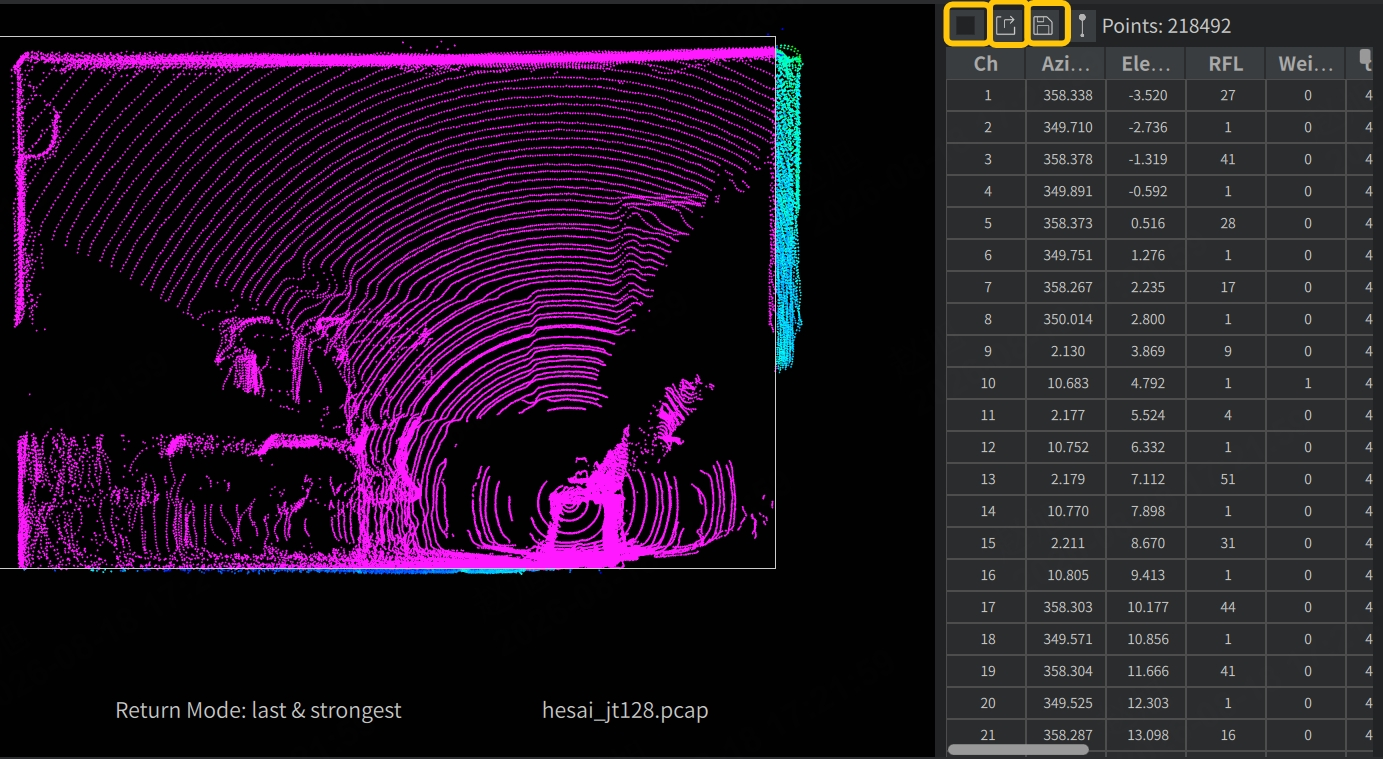
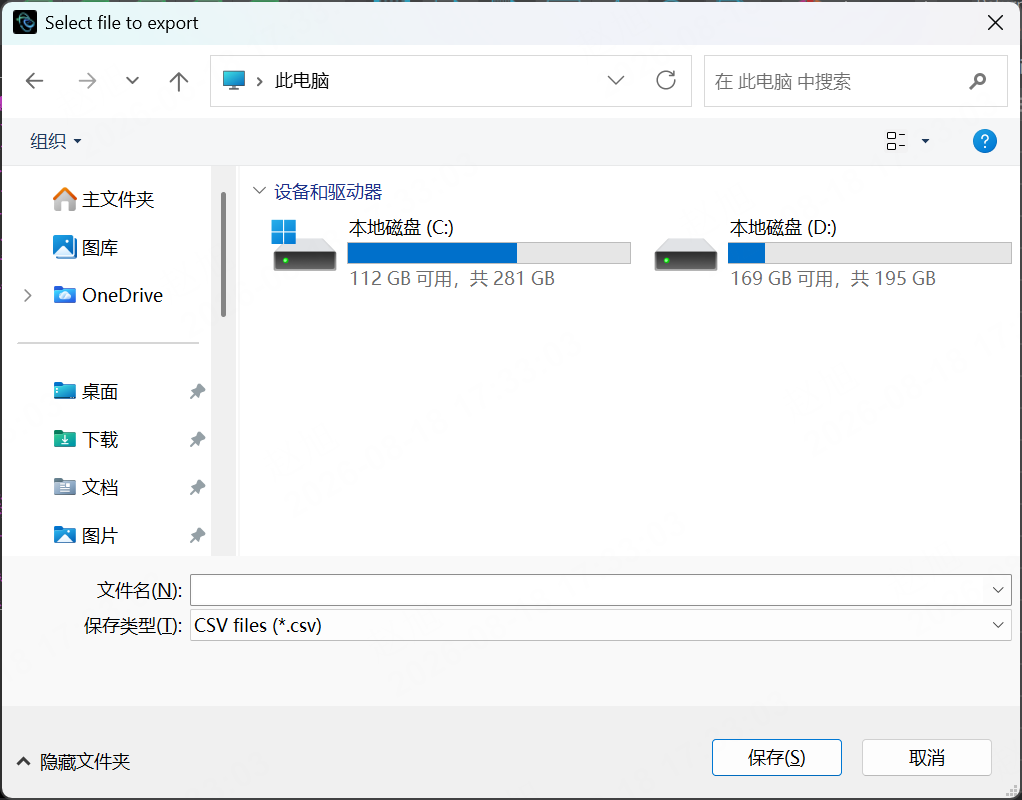
- Click the button marked in the second red box to select the corresponding path for export.
- The columns in the data list can be dragged freely, then click the button corresponding to the third red box to save, and the saved configuration will be used for subsequent use.
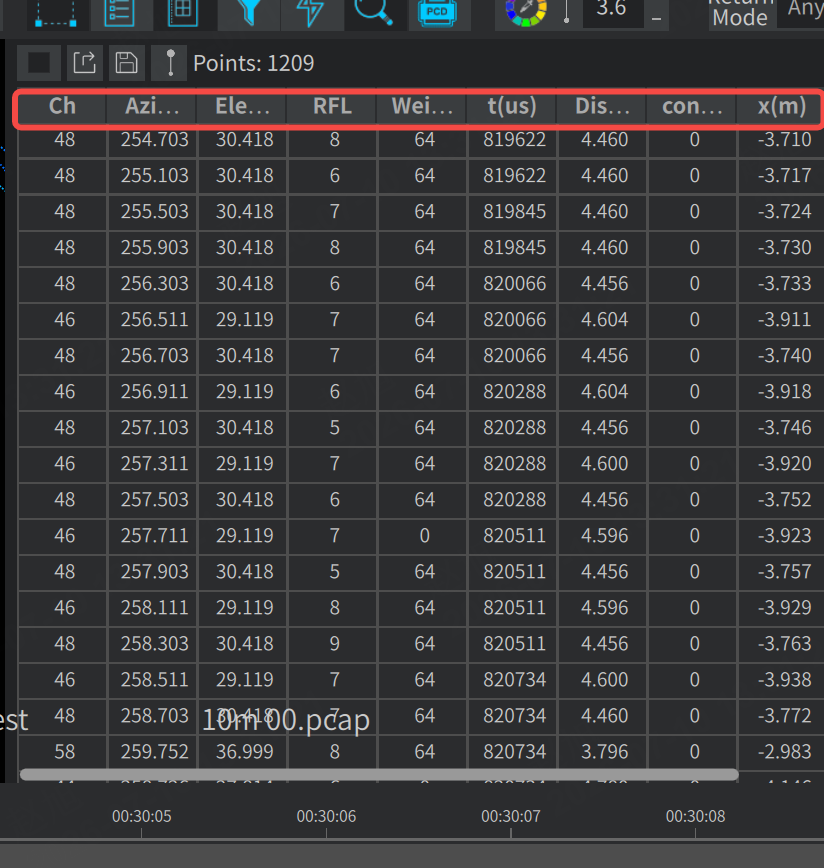
- The header definitions of each column in the data table are as follows (Note: The specific parameters displayed on this interface may vary for different product models):
| Header Name | Meaning |
|---|---|
| Ch | Channel number |
| Ele | Vertical elevation angle |
| AziCorr | Horizontal azimuth corrected according to the angle correction file |
| t | Point cloud timestamp |
| Dist | Distance |
| Field | For AT series lidars, this is the mirror number corresponding to the measurement data |
| Rfl | Reflectivity |
| AziState | Azimuth identifier, used for table lookup to calculate the firetime offset of each channel |
| Azi | Uncorrected horizontal azimuth |
| Weight Factor | Point cloud confidence (rain and fog noise marker) |
2.6 Point Cloud Filtering
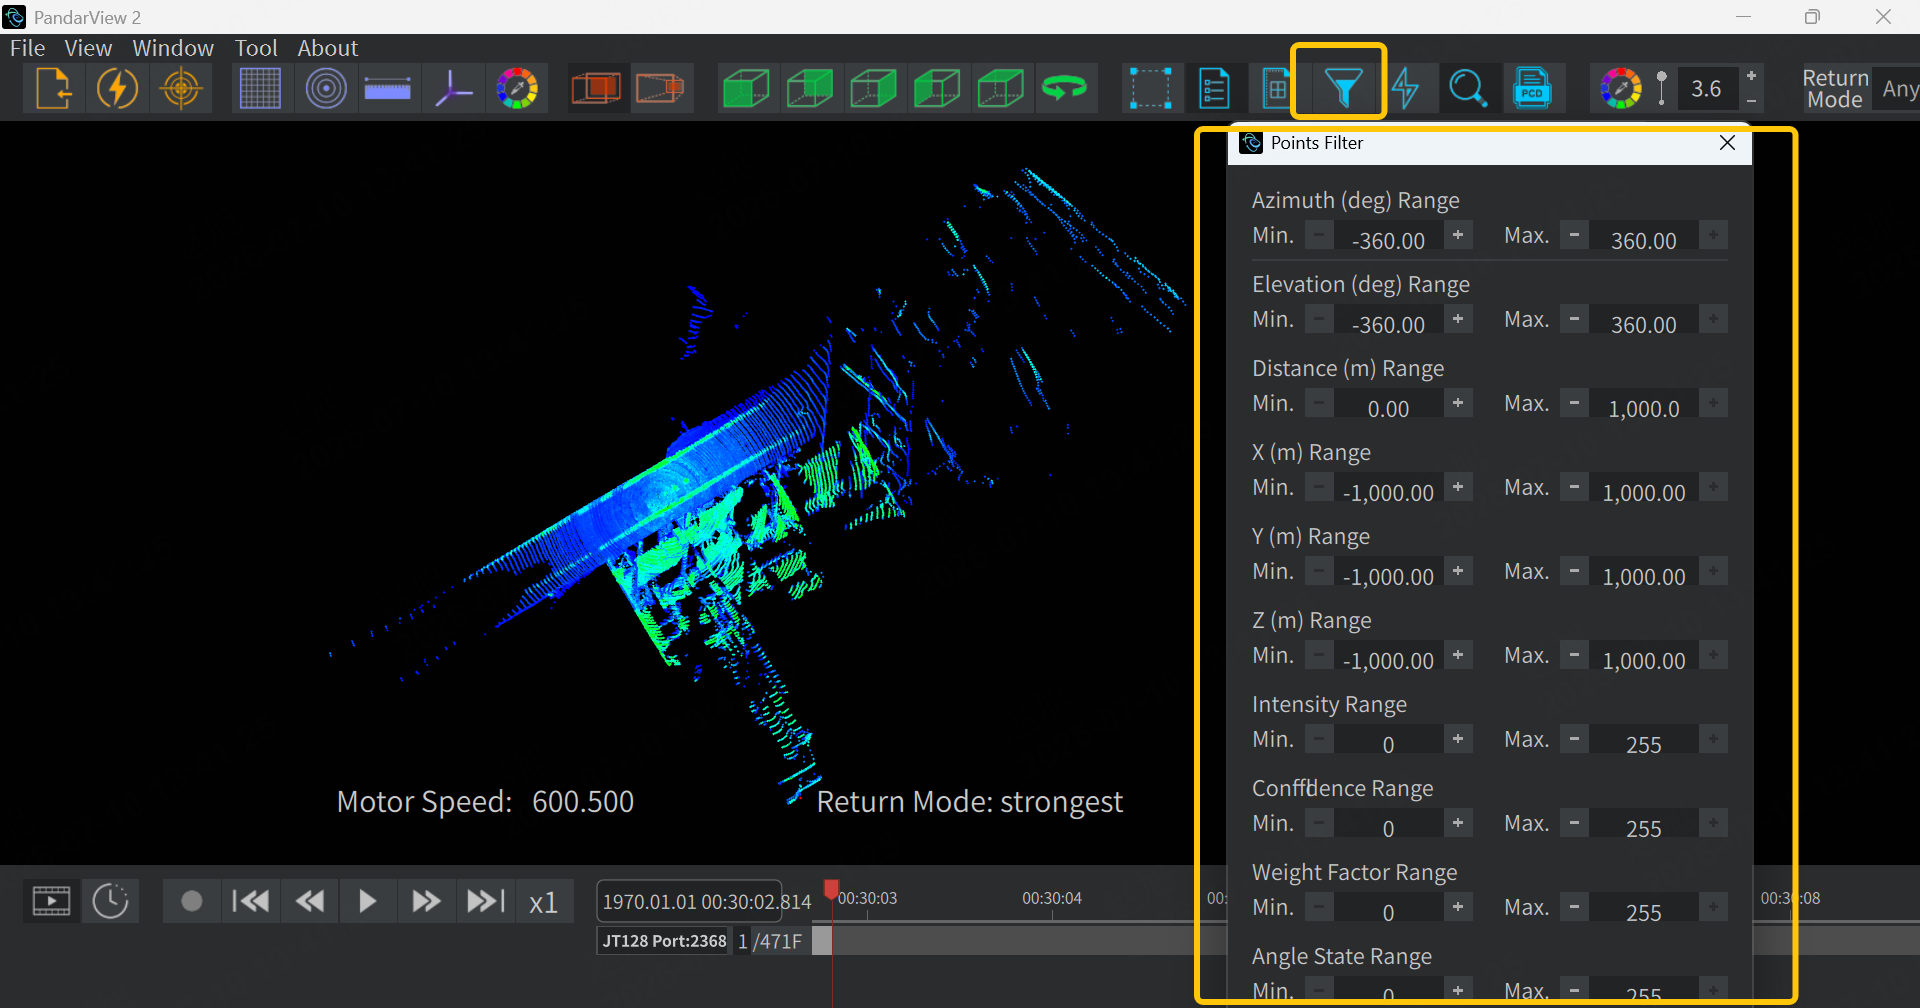
After clicking the highlighted icon (Points Filter) in the PandarView2 toolbar, user can set the valid range of each parameter to display only the data points that meet the corresponding range.
For example, setting the range of Weight Factor can filter out the labelled discrete noise points (such as rain, fog, dust, or exhaust).
- Click the highlighted part in the figure, and the corresponding configuration information will pop up.
-
After setting the filtering parameters, click the ON button at the bottom of the page in the figure below to enable filtering according to the current parameter configuration. Click ON again to turn it off. Click the Reset button to restore the default parameters.
-
Click the Import button in the figure to manually select and import a saved filtering parameter configuration file.
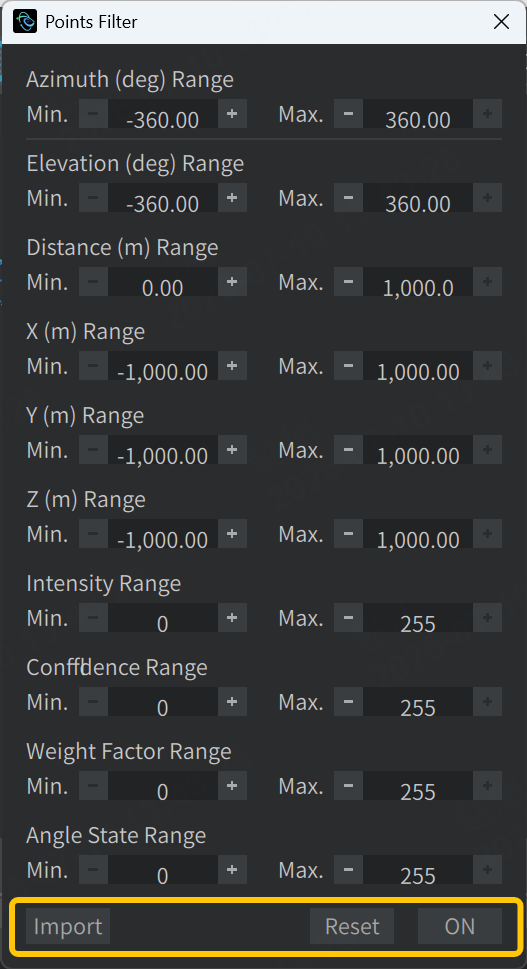
The meanings of the filtering parameters are as follows:
-
Azimuth (deg) Range: Azimuth (unit: degree) value range
- Min.: Minimum value
-360.00 - Max.: Maximum value
360.00
- Min.: Minimum value
-
Elevation (deg) Range: Elevation angle (unit: degree) value range
- Min.: Minimum value
-360.00 - Max.: Maximum value
360.00
- Min.: Minimum value
-
Distance (m) Range: Ranging distance (unit: meter) value range
- Min.: Minimum value
0.00 - Max.: Maximum value
1000.00
- Min.: Minimum value
-
X (m) Range: X-axis coordinate (unit: meter) value range
- Min.: Minimum value
-1000.00 - Max.: Maximum value
1000.00
- Min.: Minimum value
-
Y (m) Range: Y-axis coordinate (unit: meter) value range
- Min.: Minimum value
-1000.00 - Max.: Maximum value
1000.00
- Min.: Minimum value
-
Z (m) Range: Z-axis coordinate (unit: meter) value range (vertical height direction)
- Min.: Minimum value
-1000.00 - Max.: Maximum value
1000.00
- Min.: Minimum value
-
Intensity Range: Reflection intensity value range (echo intensity of lidar point cloud)
- Min.: Minimum value
230 - Max.: Maximum value
0
- Min.: Minimum value
-
Confidence Range: Confidence value range (indicates the reliability of the point cloud)
- Min.: Minimum value
0 - Max.: Maximum value
255
- Min.: Minimum value
-
Weight Factor Range: Weight coefficient value range
- Min.: Minimum value
0 - Max.: Maximum value
255
- Min.: Minimum value
-
Angle State Range: Angle state value range
- Min.: Minimum value
0 - Max.: Maximum value
255
- Min.: Minimum value
Note: Point cloud filtering settings only apply to the point cloud displayed on the current PandarView interface, and do not affect recorded and saved PCAP files.
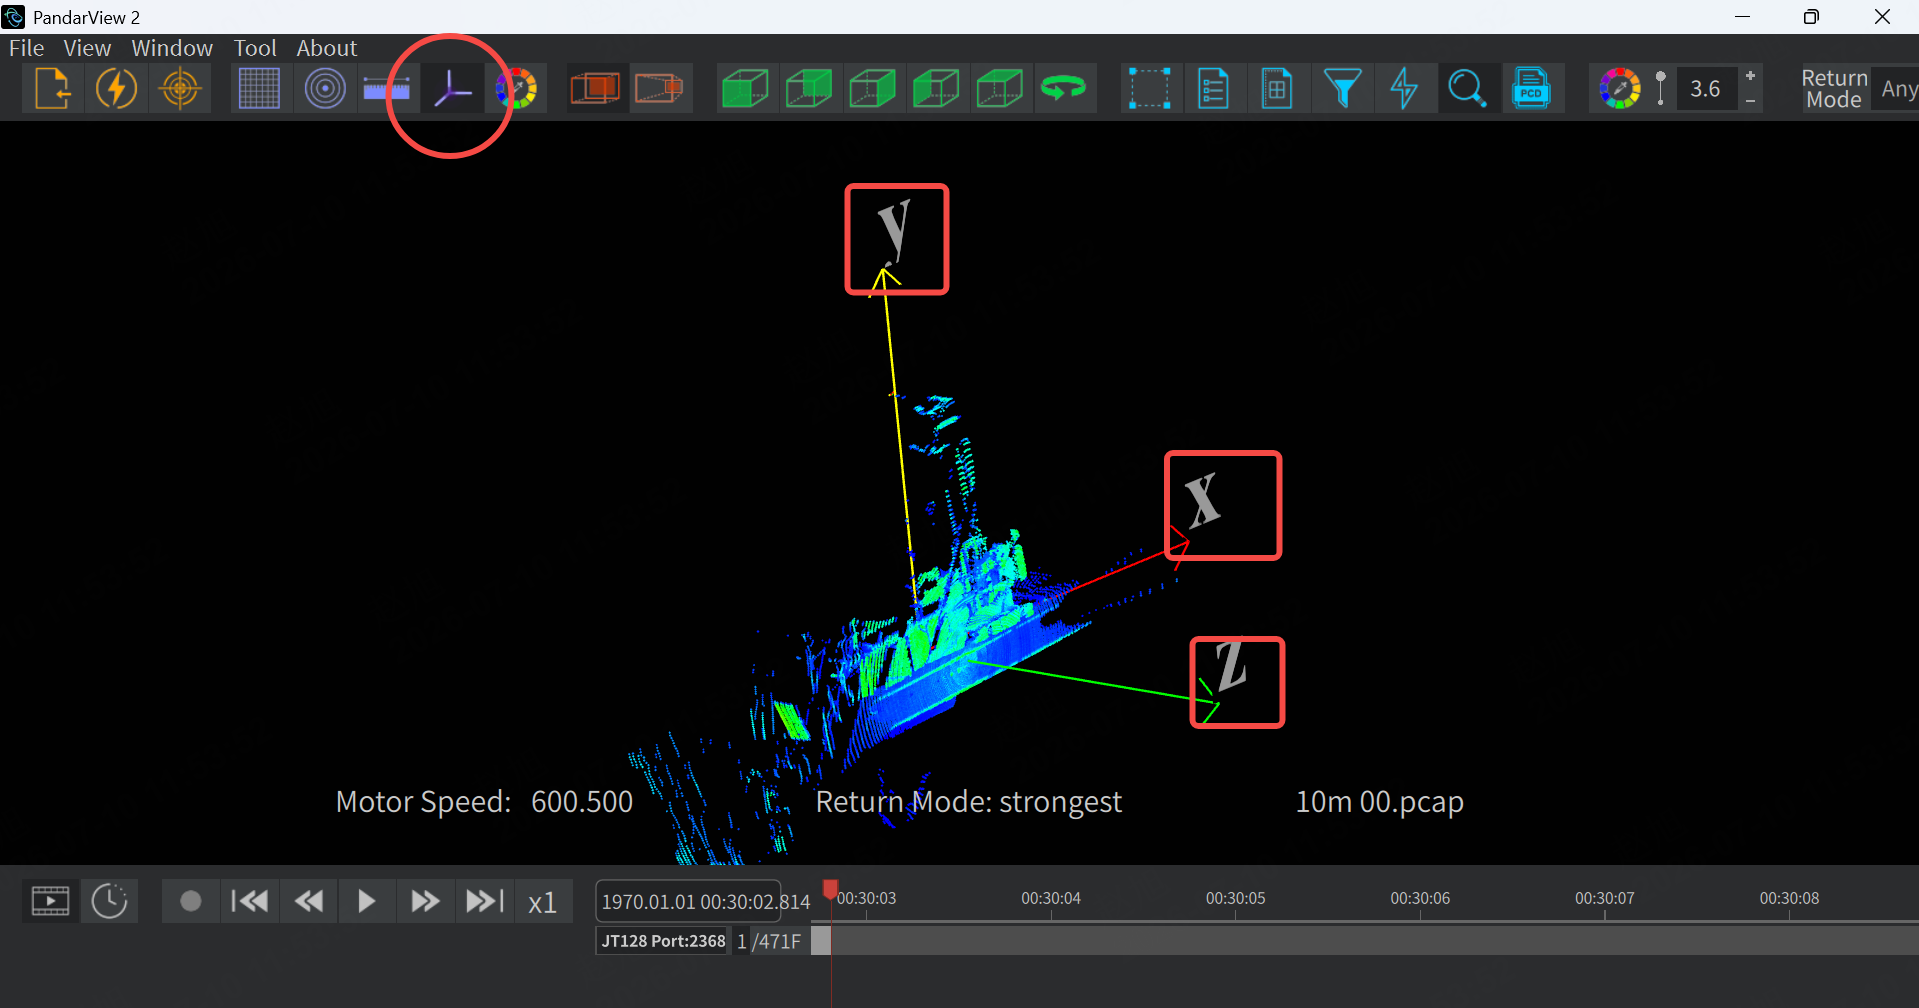
2.7 Point Cloud Coordinate System Display
As shown below, click the coordinate axis button in the toolbar to display the X, Y, and Z axes of the point cloud in real time.
2.8 Point Cloud Projection Mode
PandarView2 supports two projection modes: orthographic projection and perspective projection, corresponding to the highlighted buttons in the figure below:
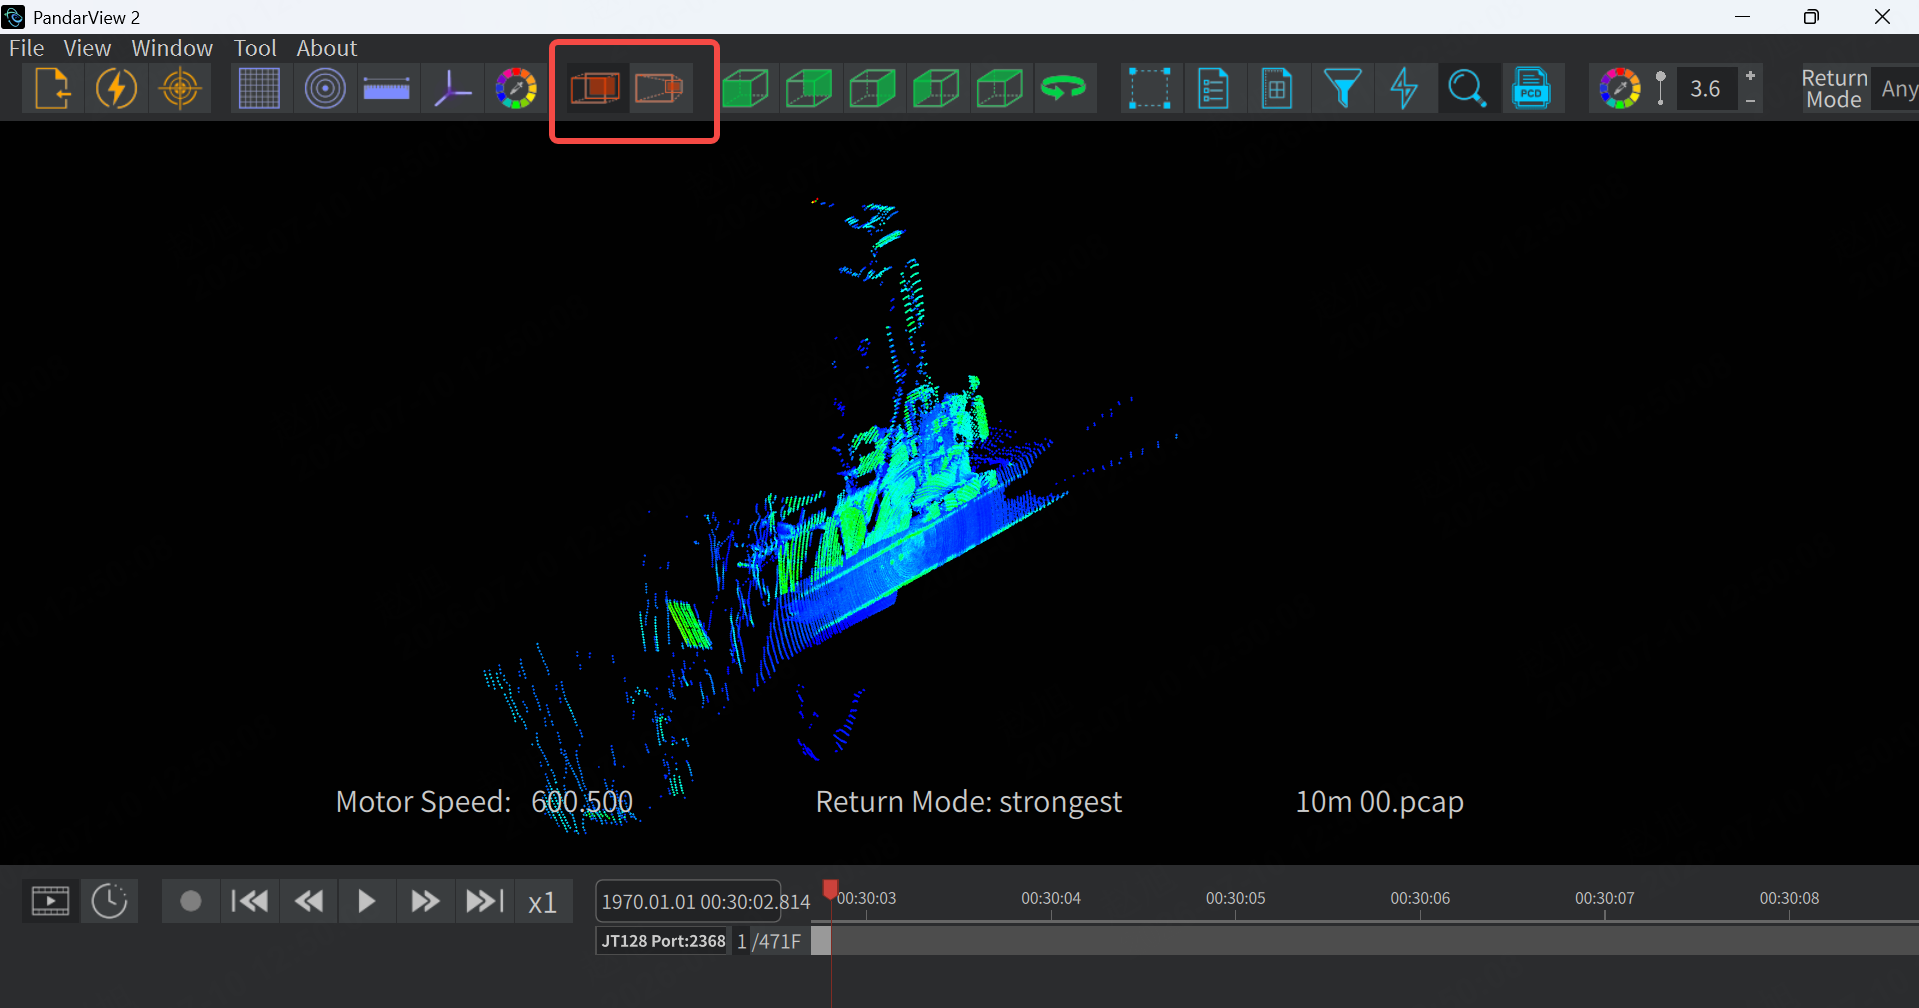
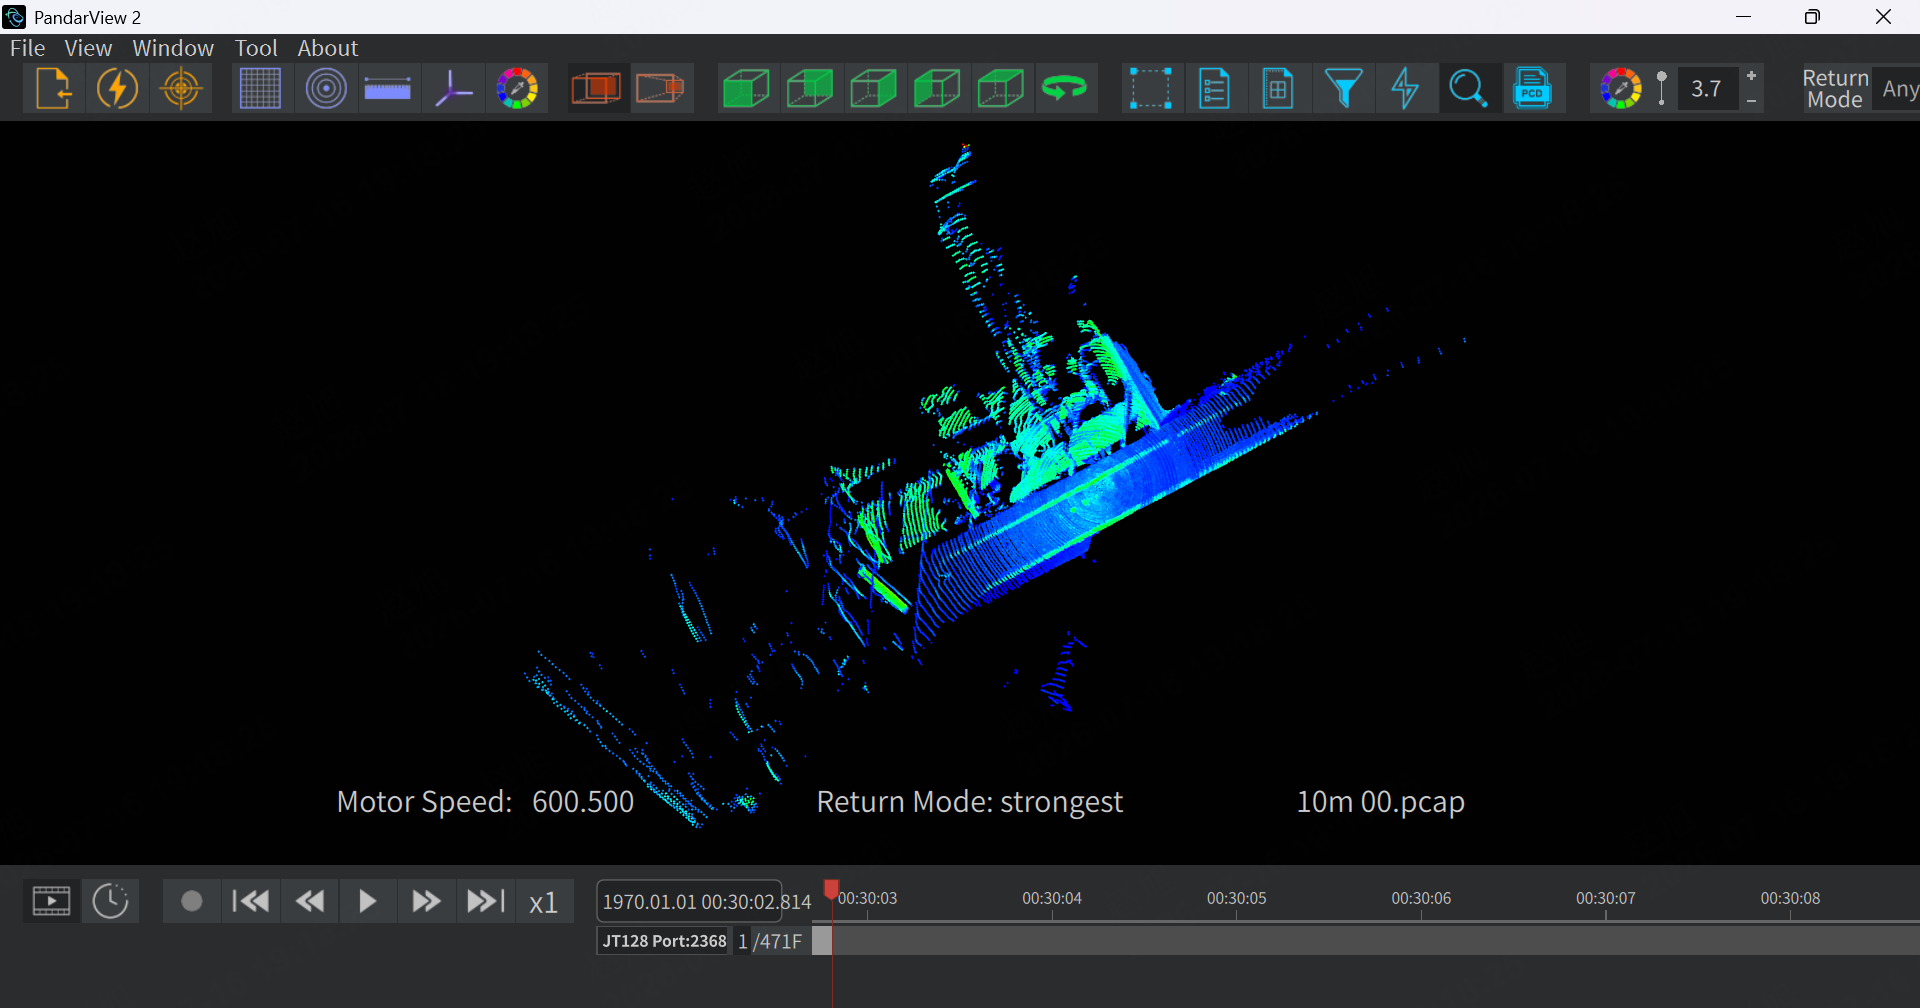
1. Orthographic Projection: Parallel light rays are projected perpendicularly onto the imaging plane, all projection rays are parallel to each other, and there is no effect of objects being larger when closer and smaller when farther away. It is suitable for precision, alignment, and measurement work. The corresponding point cloud effect is shown in the figure below:
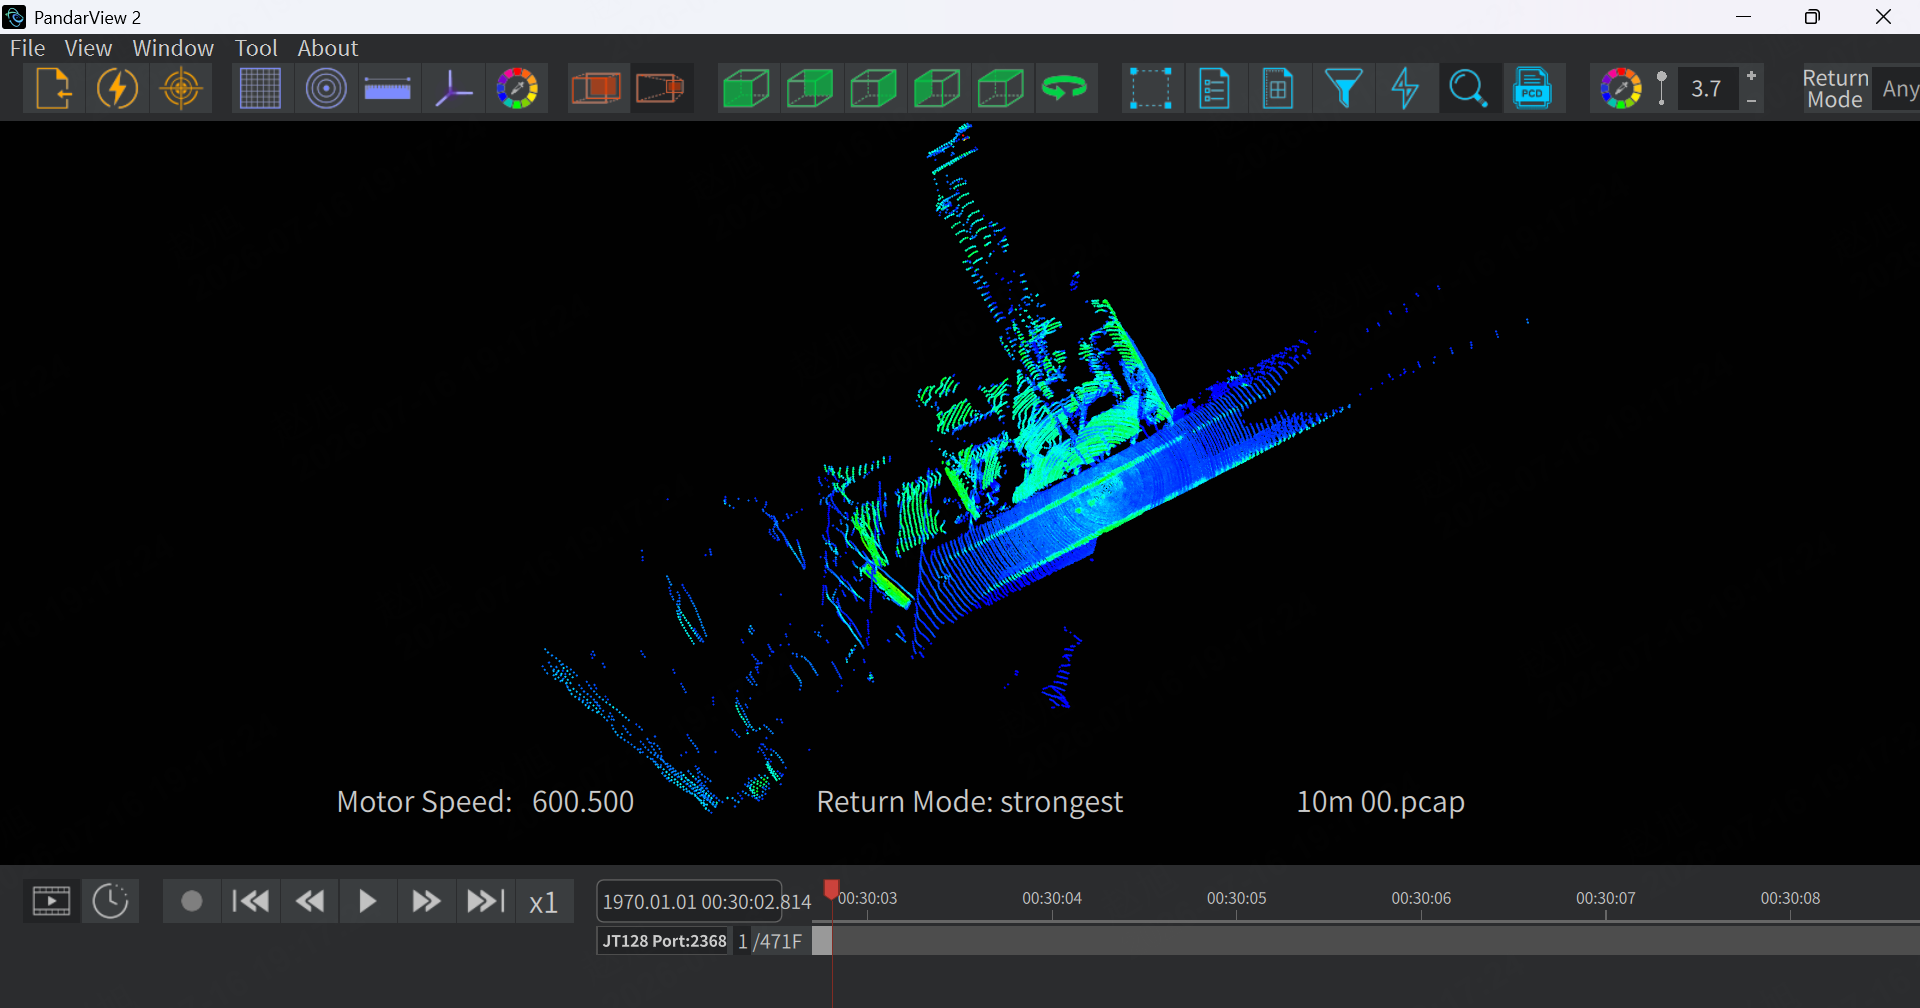
2. Perspective Projection: All lines of sight converge at the camera viewpoint (pinhole), following the laws of human vision, with objects being larger when closer and smaller when farther away, and parallel lines intersecting at the vanishing point in the distance. It is suitable for simulation of real vehicle vision, dynamic road testing, and algorithm simulation. The corresponding point cloud effect is shown in the figure below:
2.9 Point Cloud View Switching
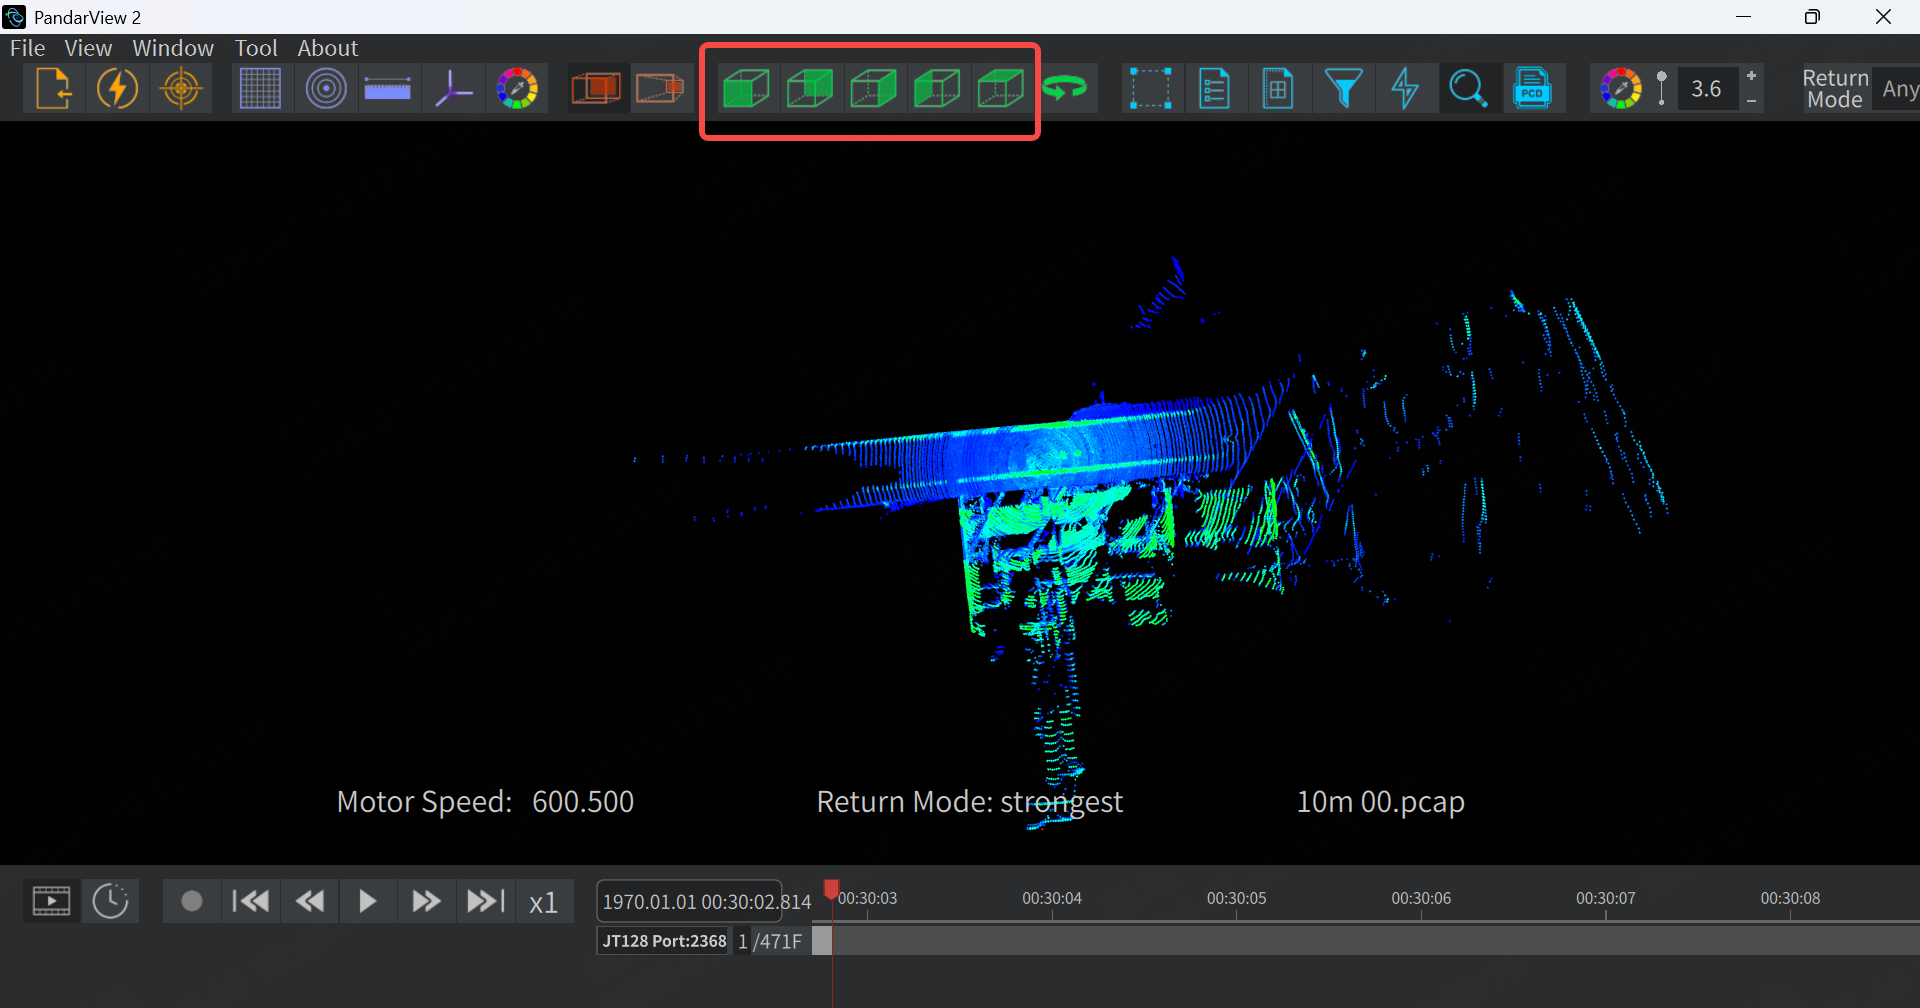
PandarView2 supports viewing point clouds from five different perspectives: front view, rear view, left view, right view, and top view. Click the highlighted button in the figure below to select and switch the corresponding observation perspective:
2.10 Point Cloud View Rotation
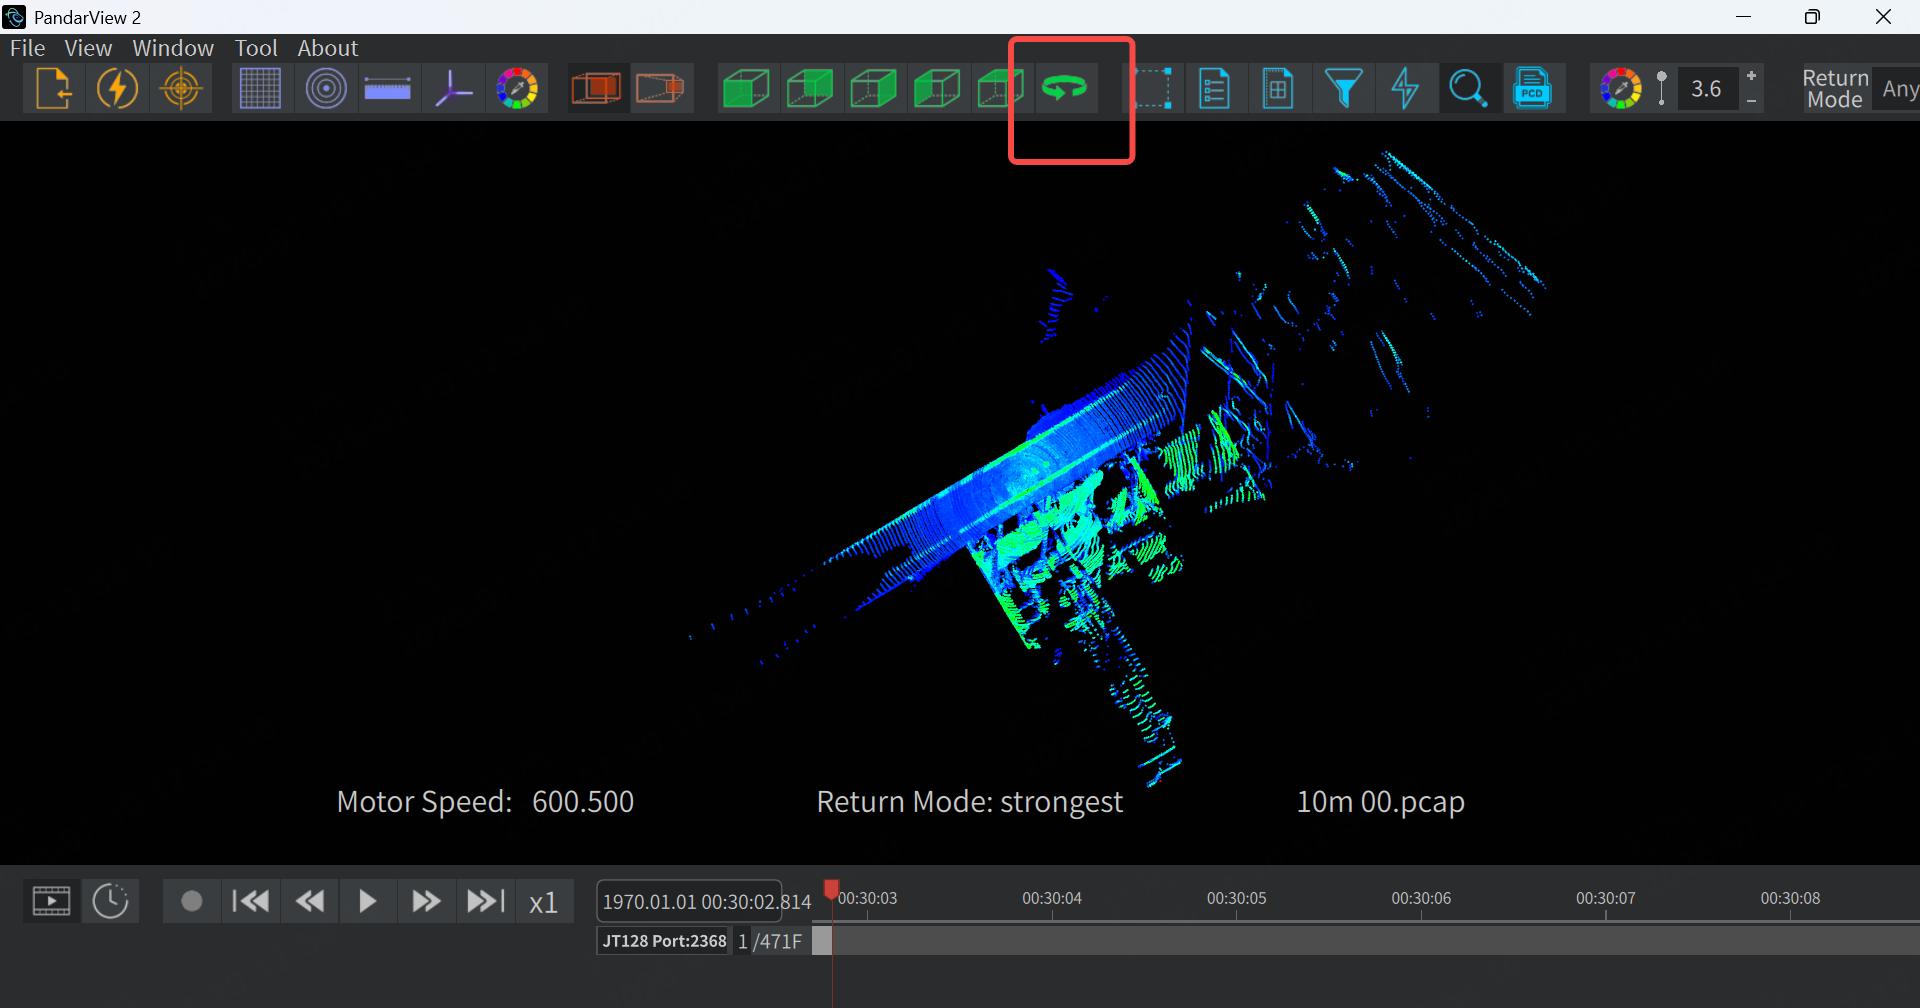
After clicking the highlighted button as shown below, the point cloud view will rotate automatically.
2.11 Laser Scanning Trajectory
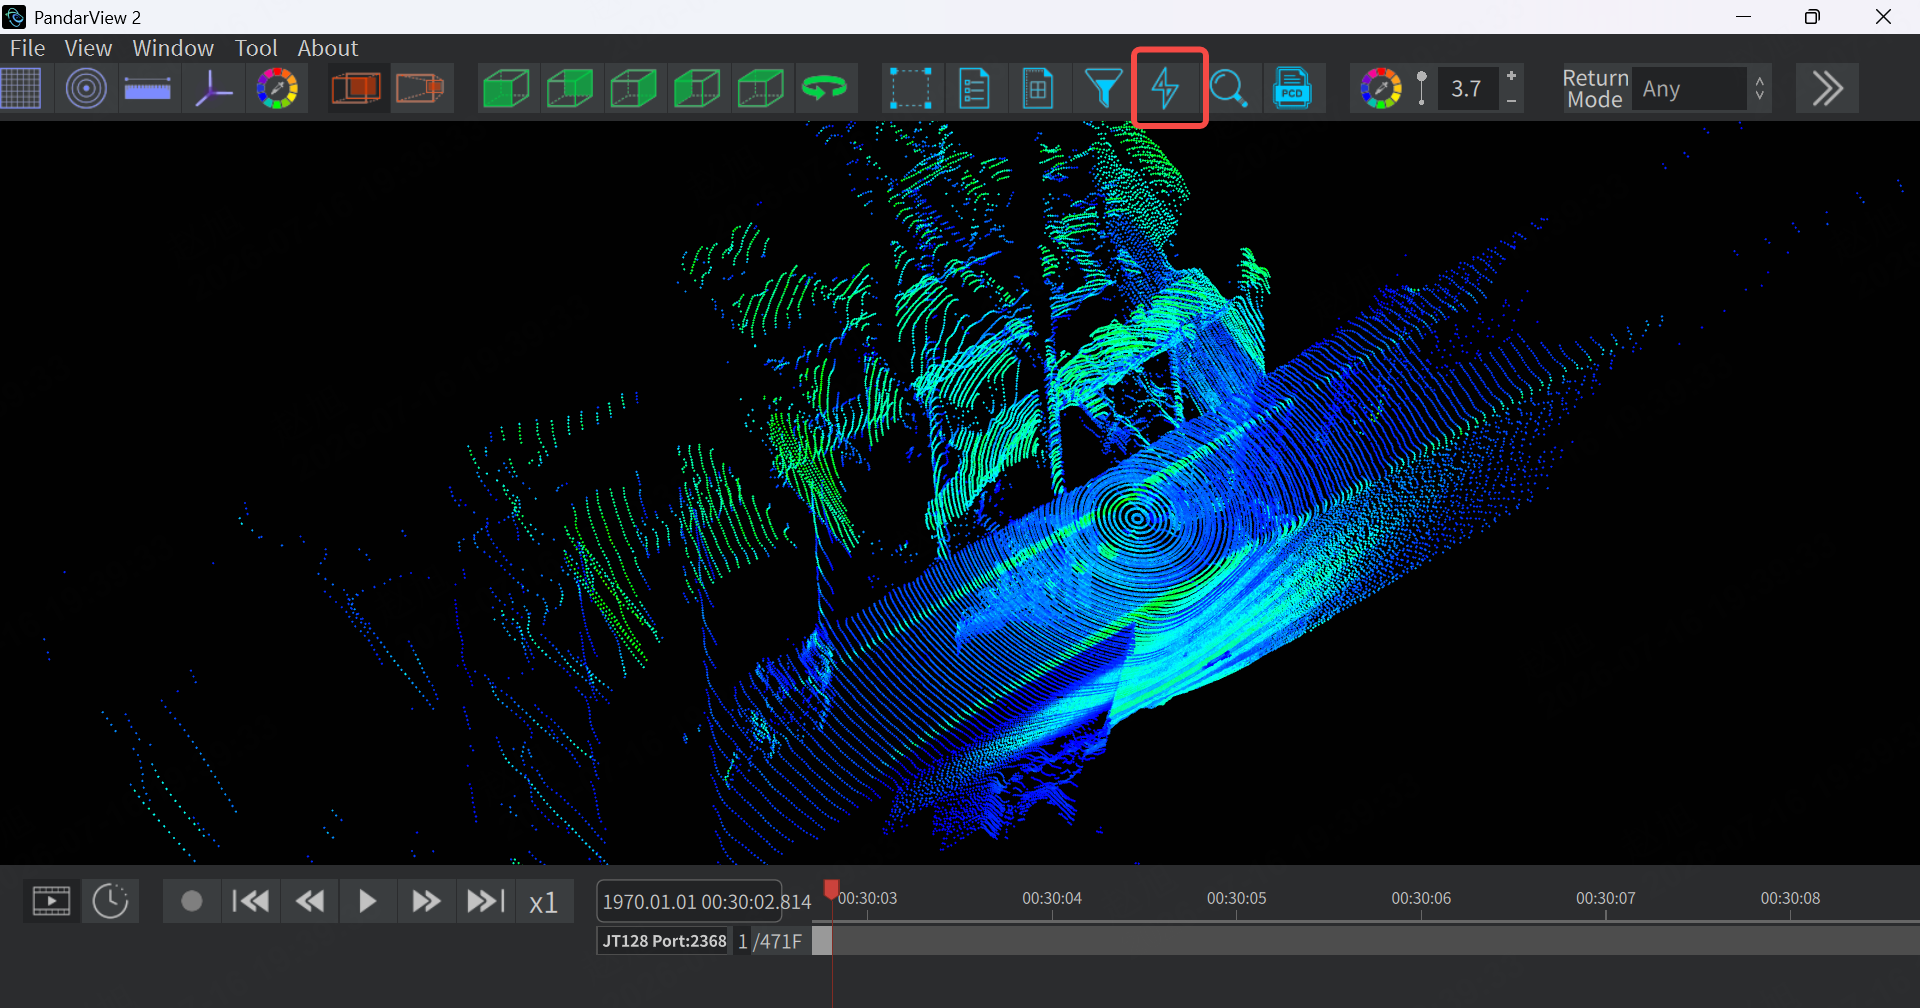
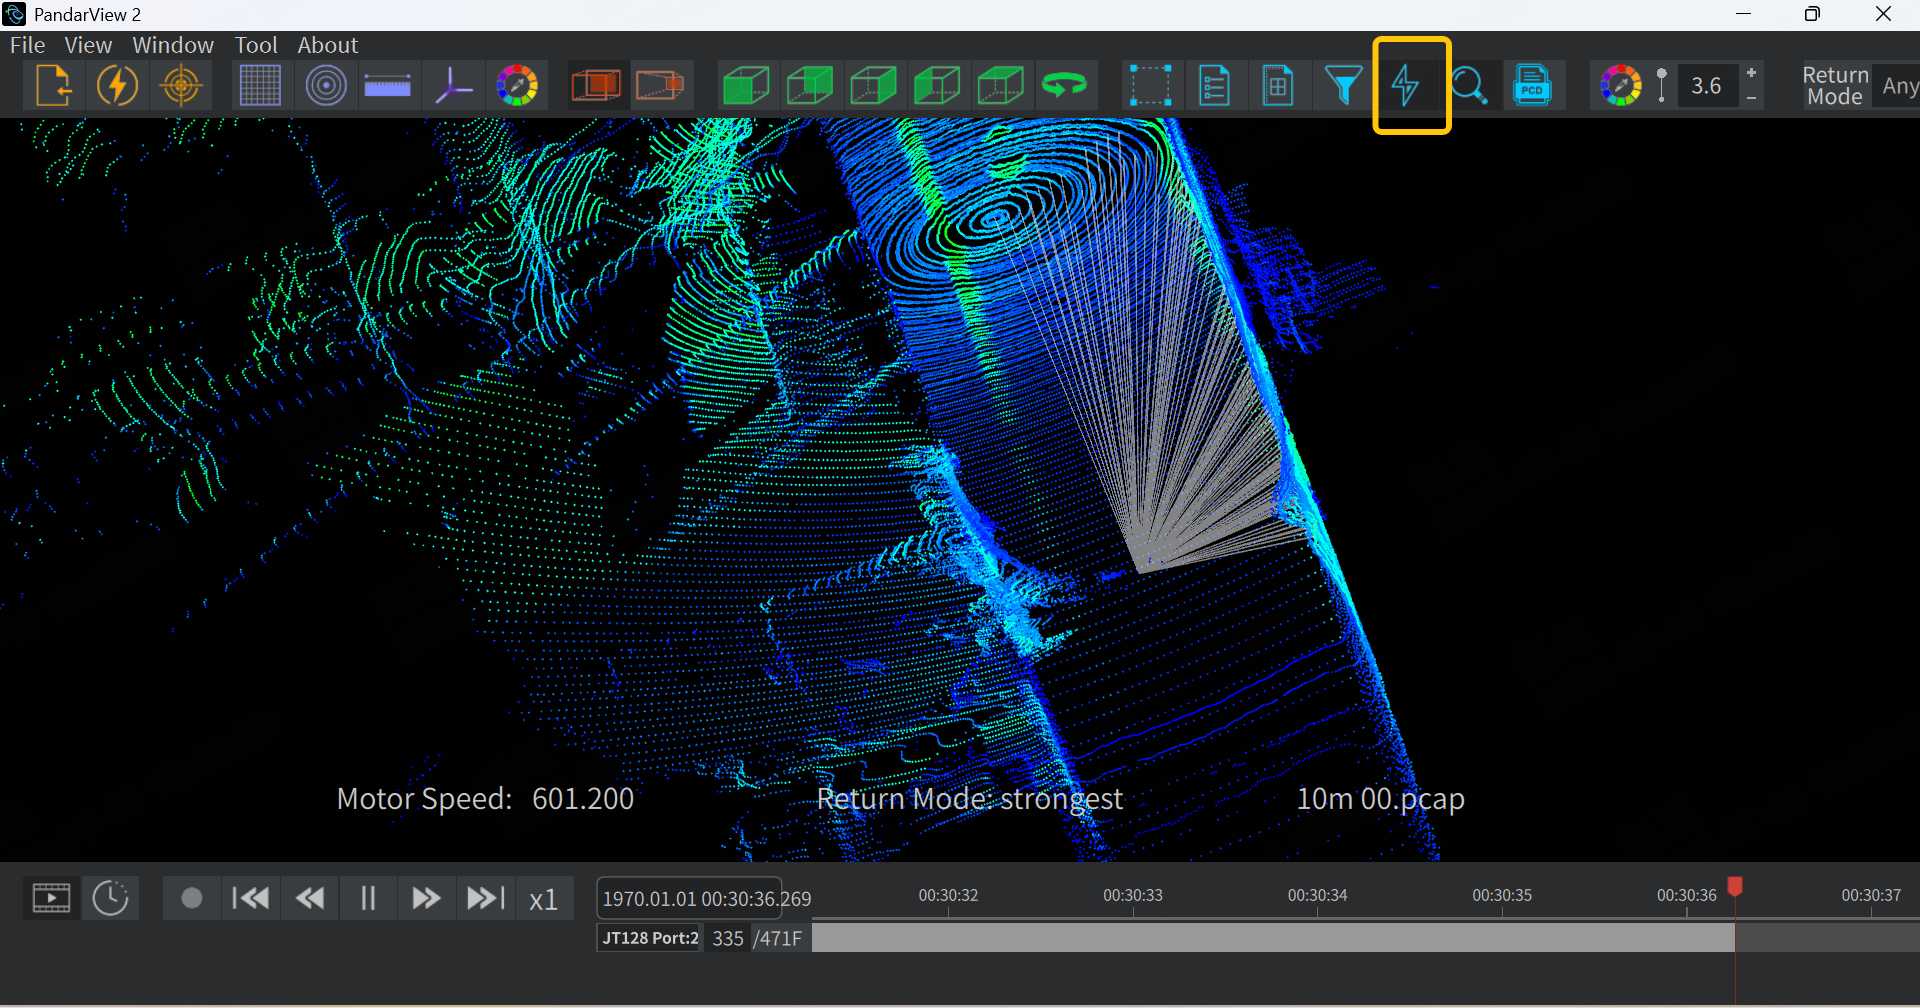
After clicking the highlighted button as shown below, the laser scanning trajectory corresponding to the current point cloud will be displayed.
The following is a comparison of the effects before and after enabling this function:
| Before enabling | After enabling |
|---|---|
 |  |
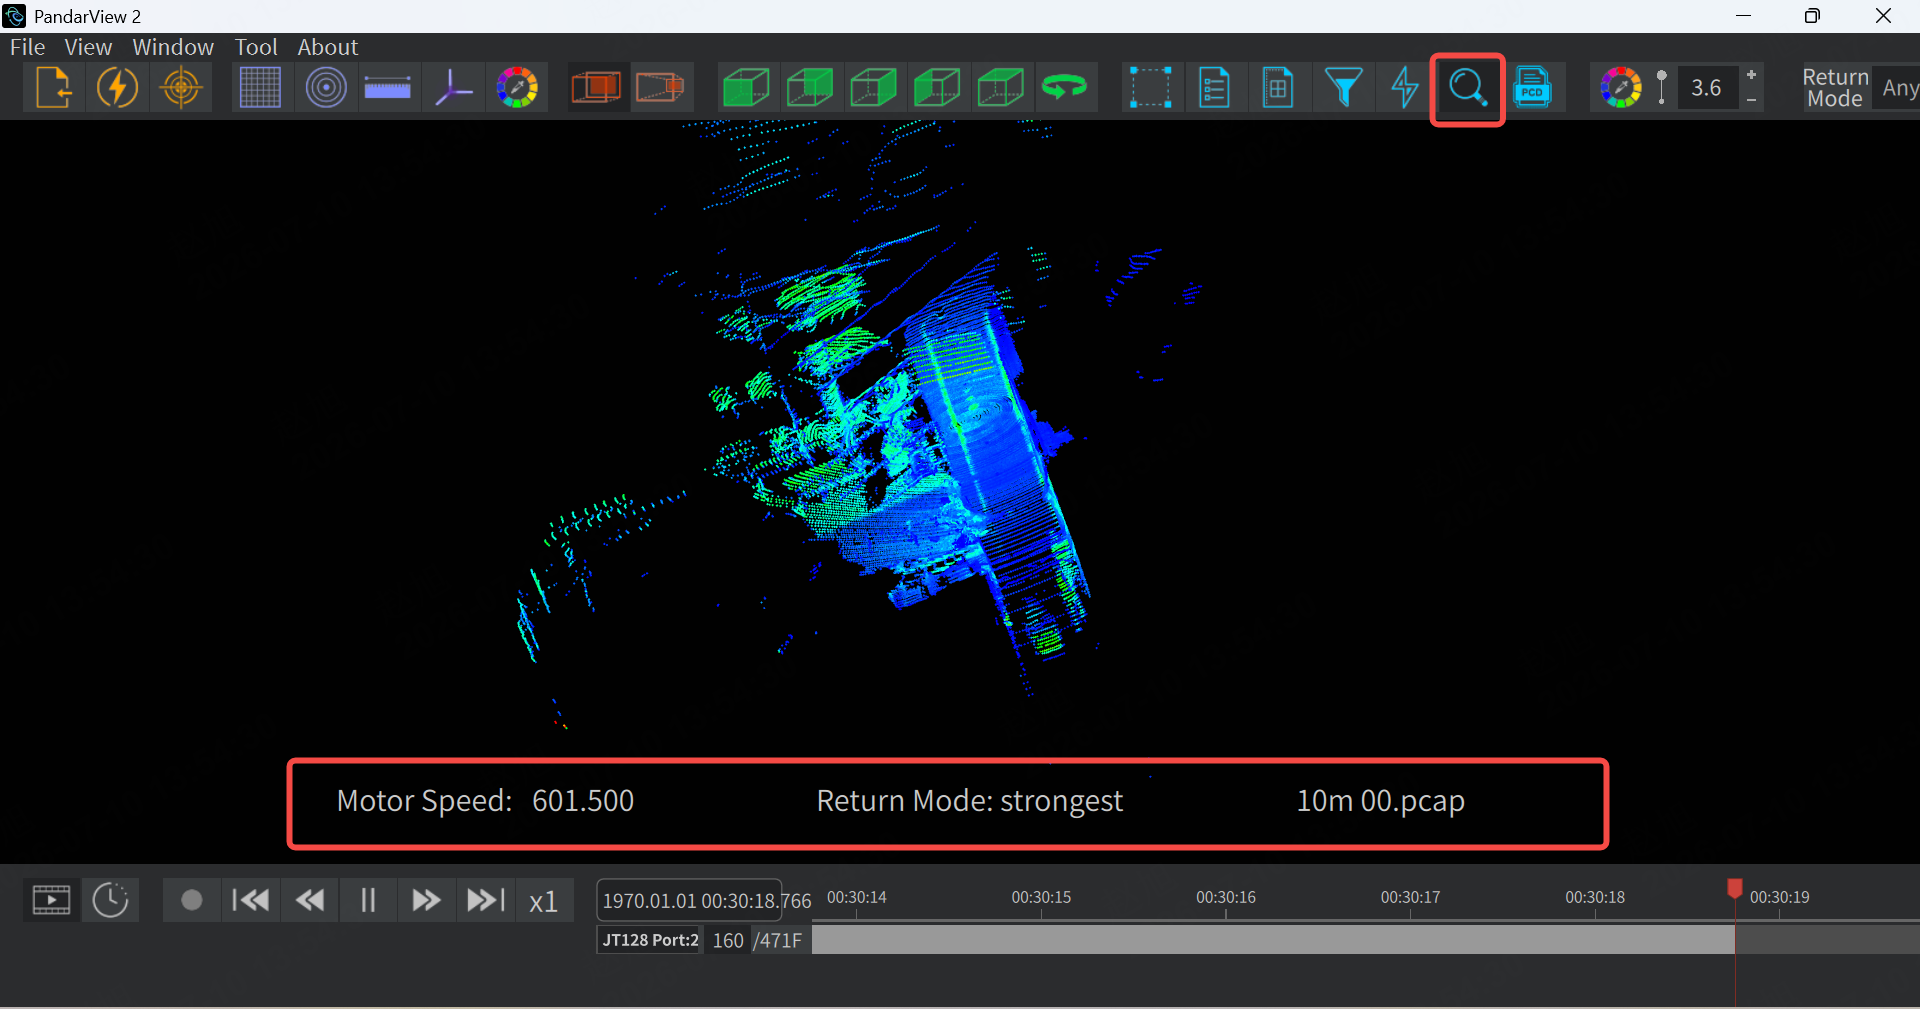
2.12 lidar Status Display
After clicking the highlighted button as shown below, information such as rotation speed and echo mode will be displayed at the bottom of the point cloud window.
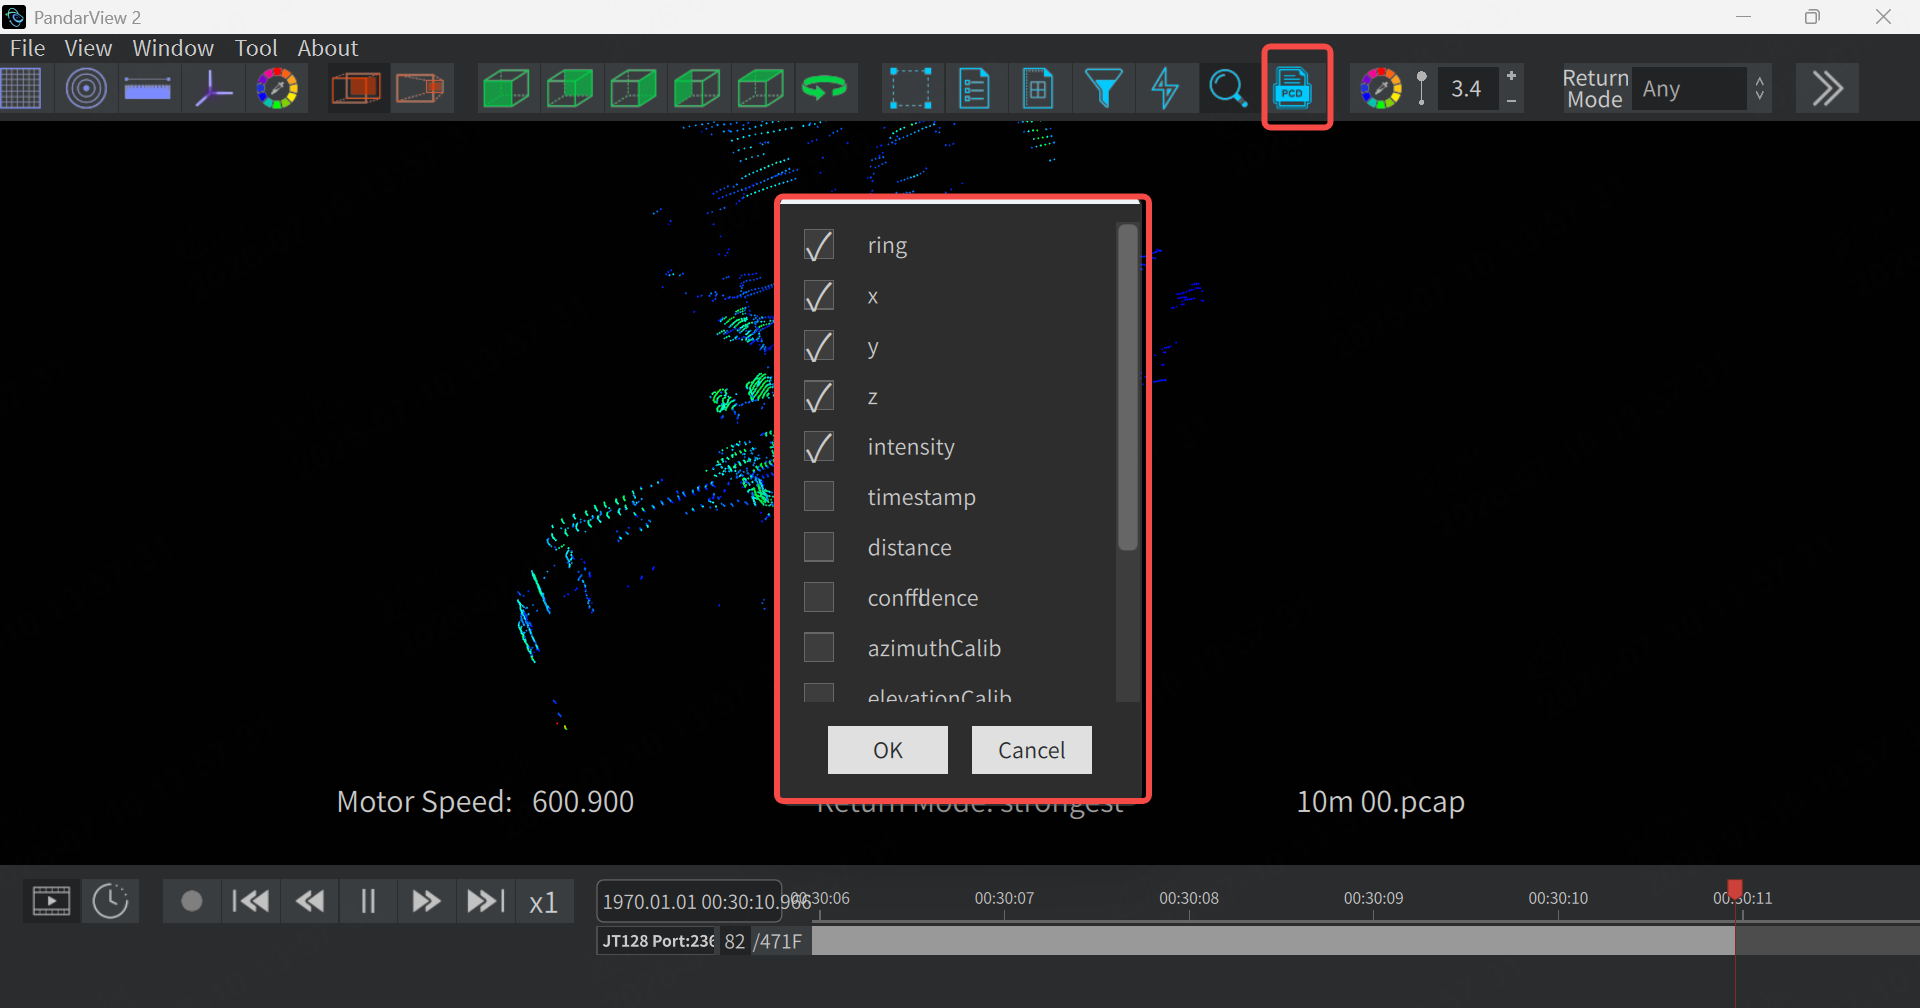
2.13 PCD Data Export
After clicking the highlighted button as shown below, a field selection window will pop up.
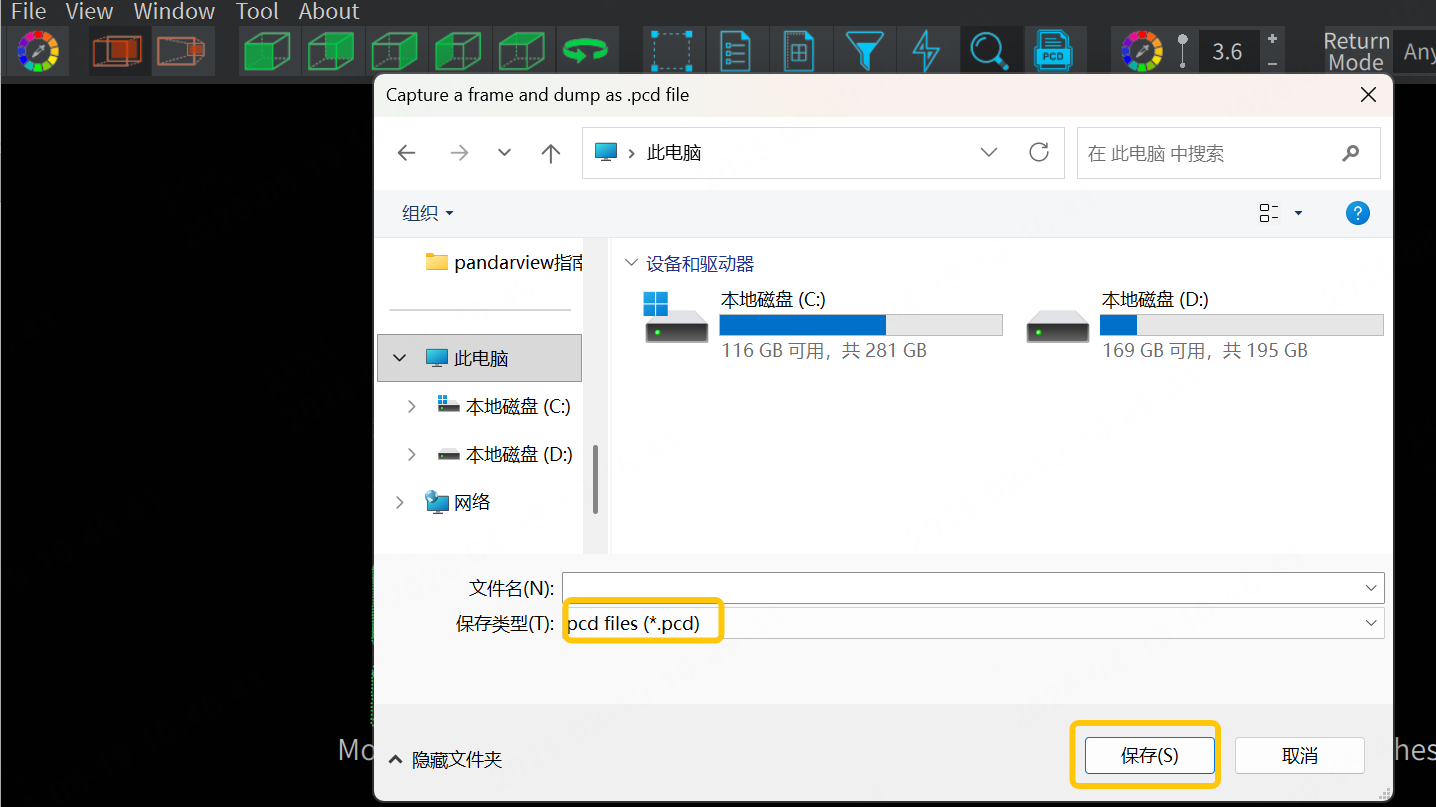
After clicking the OK button, select the path and file name where the exported PCD data will be stored.
2.14 Point Cloud Color Setting
Click the highlighted button as shown below to customize the point cloud display color.
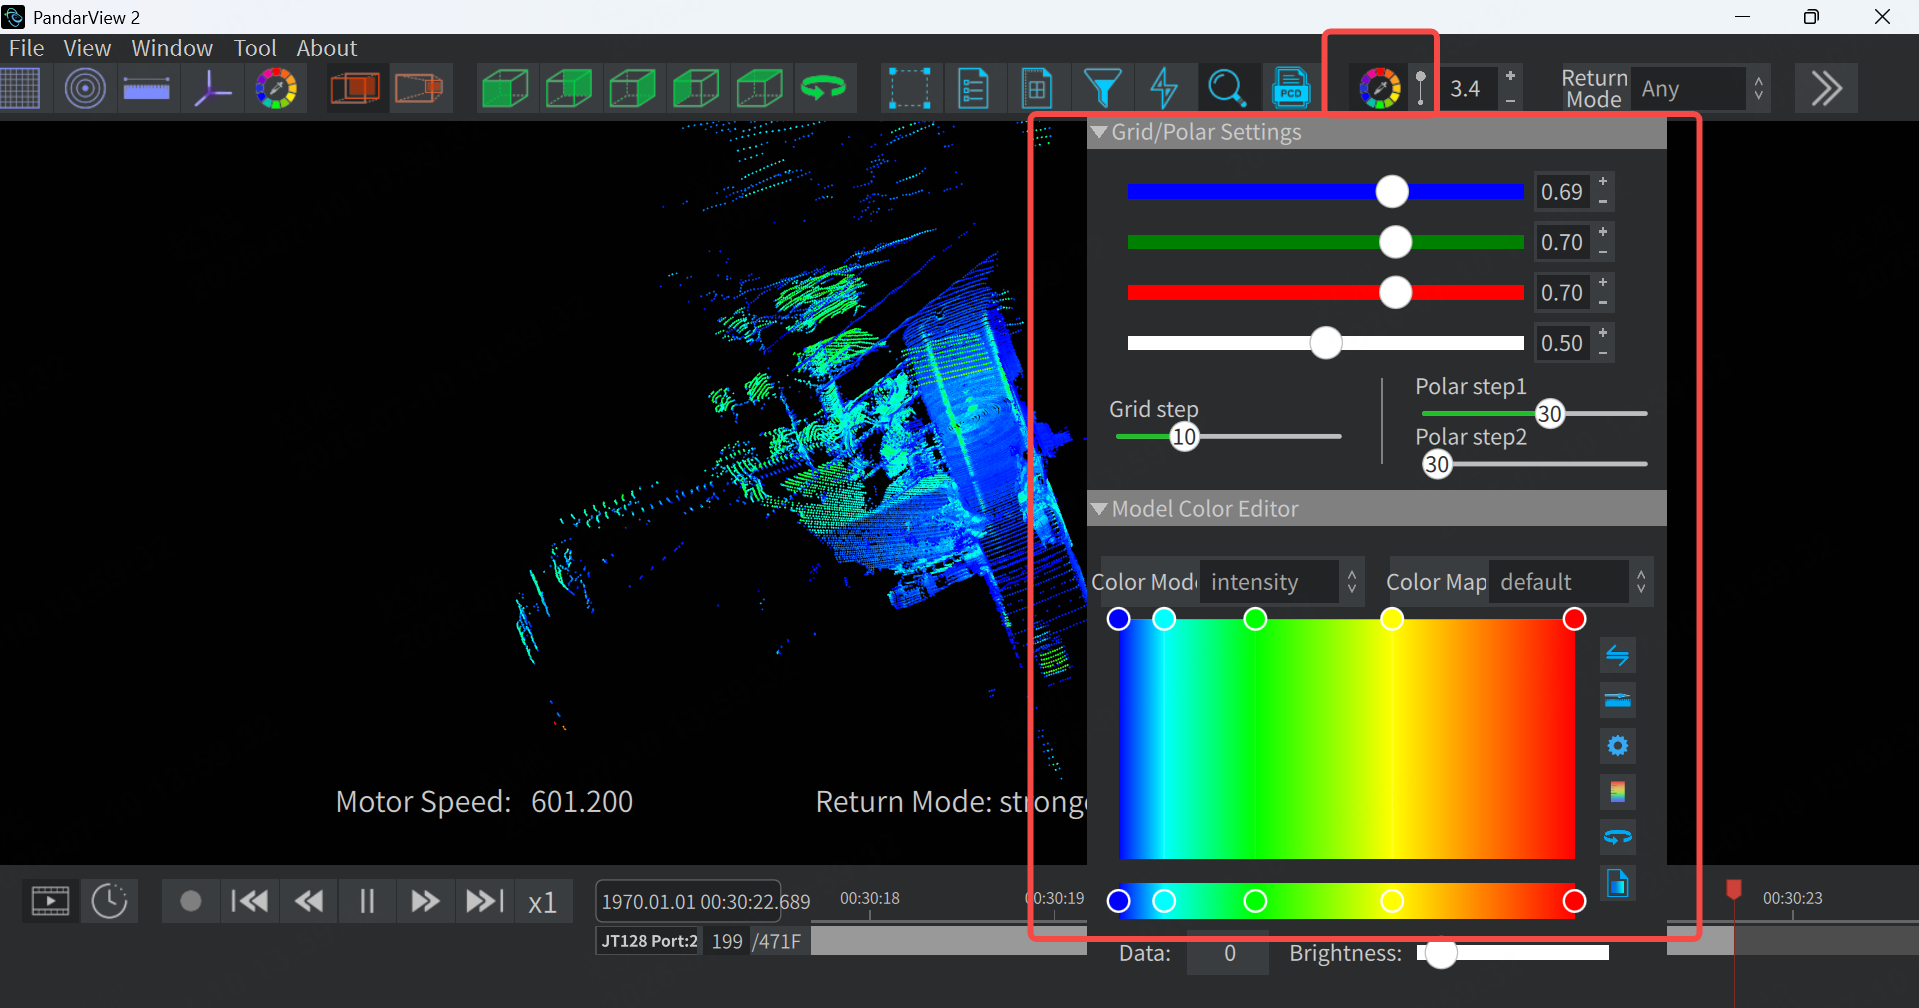
2.14.1 Color Mode
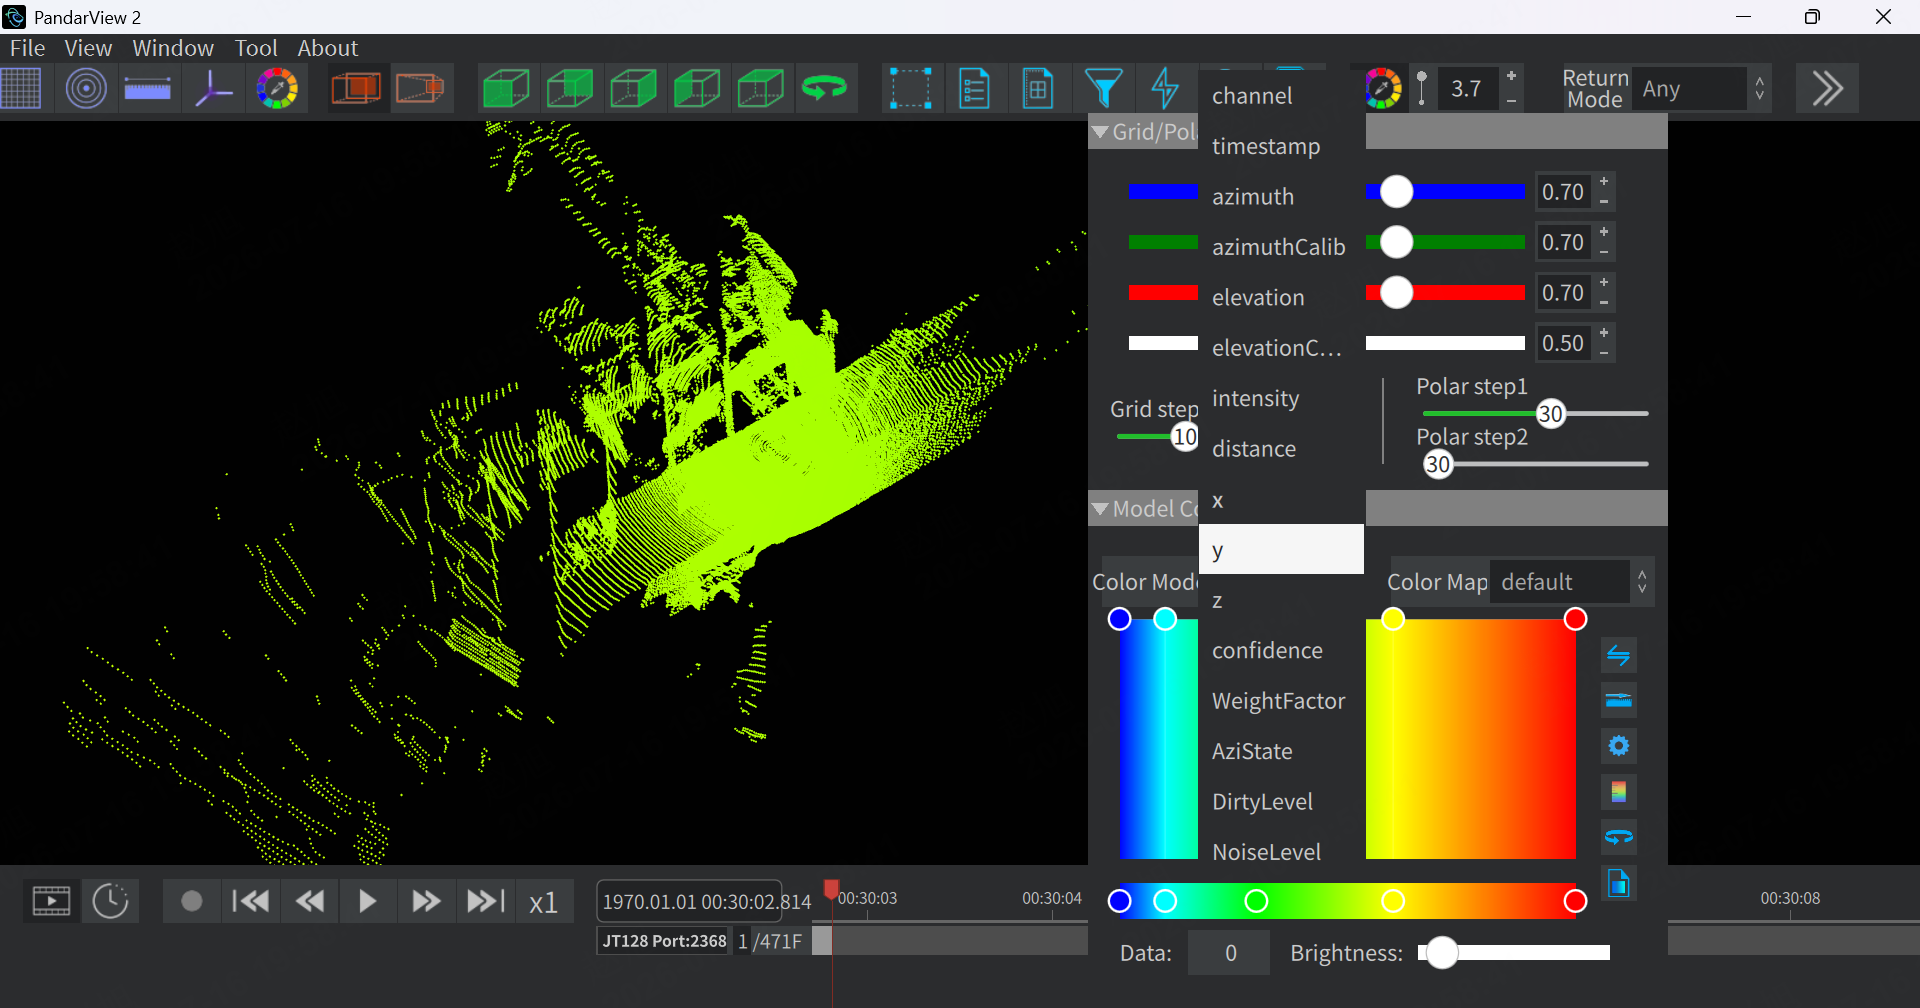
Click Color Mode to select the field mode for color mapping. As shown in the figure below, coloring according to the Y-axis of the 3D coordinates is selected here.
2.14.2 Color Map
Click Color Map to adjust the color type and mapping relationship of the current point cloud.
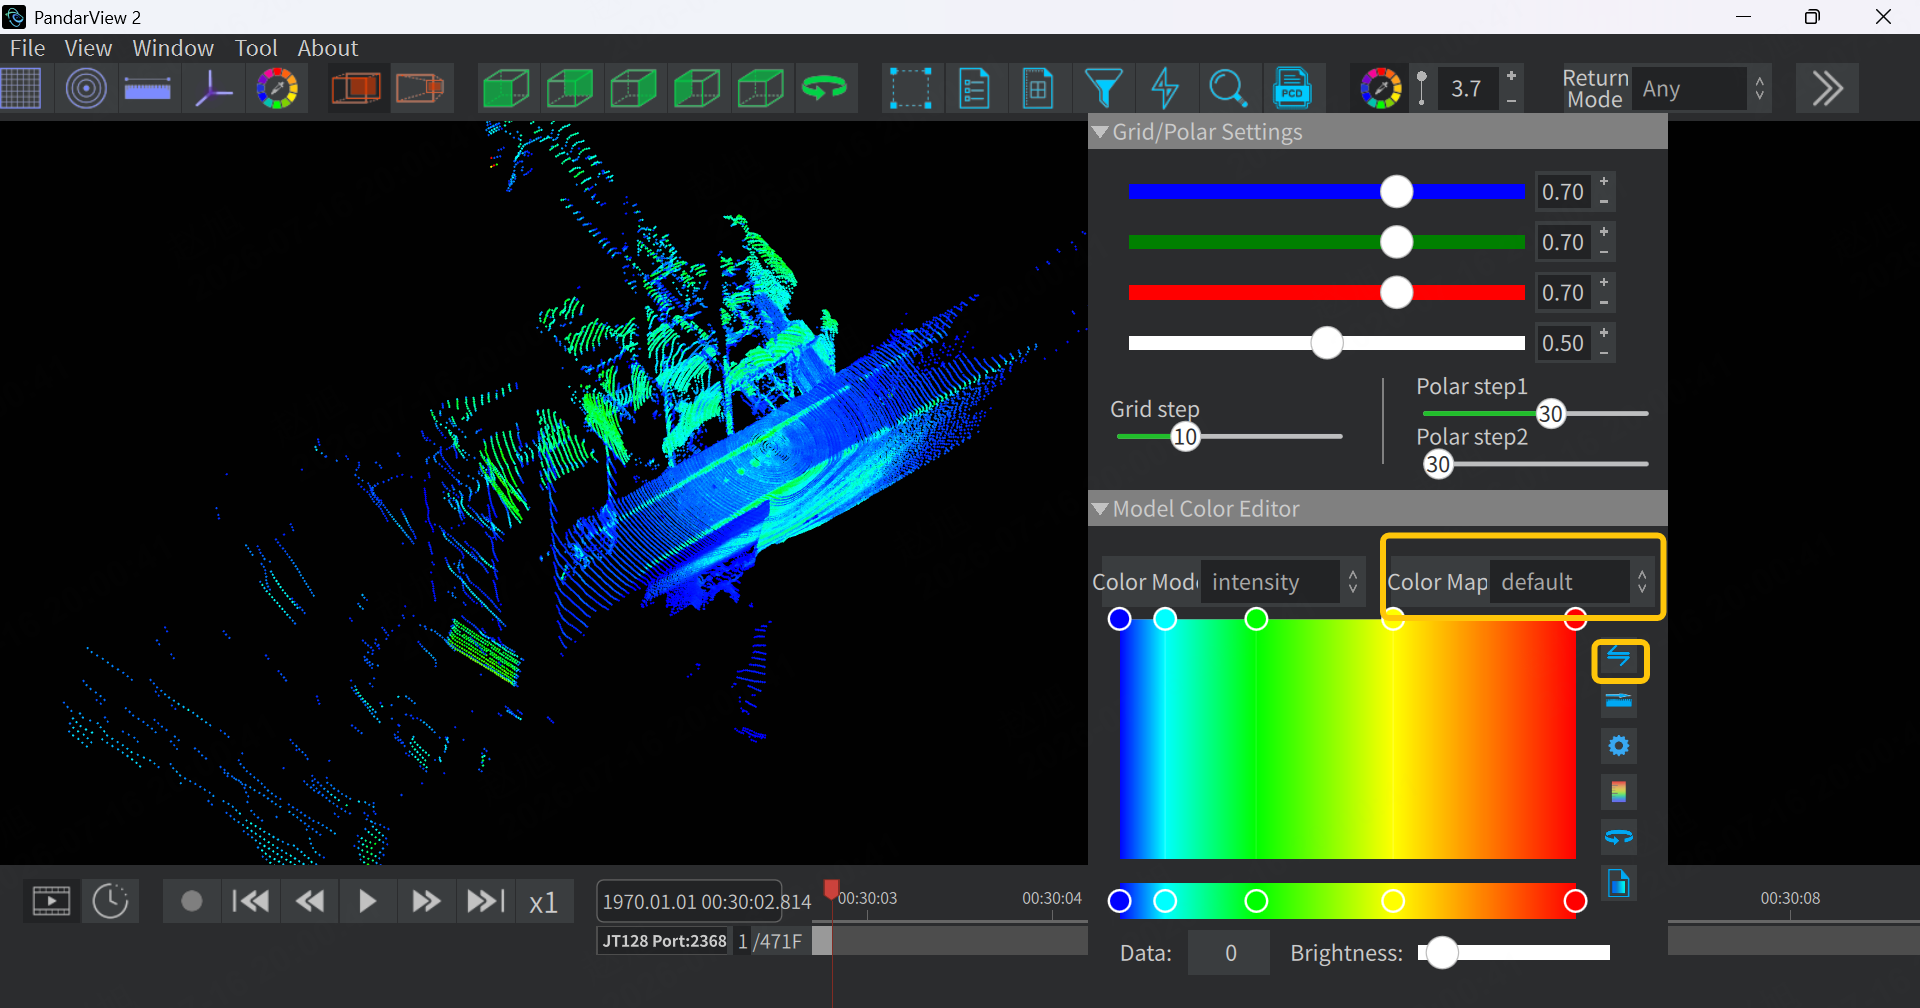
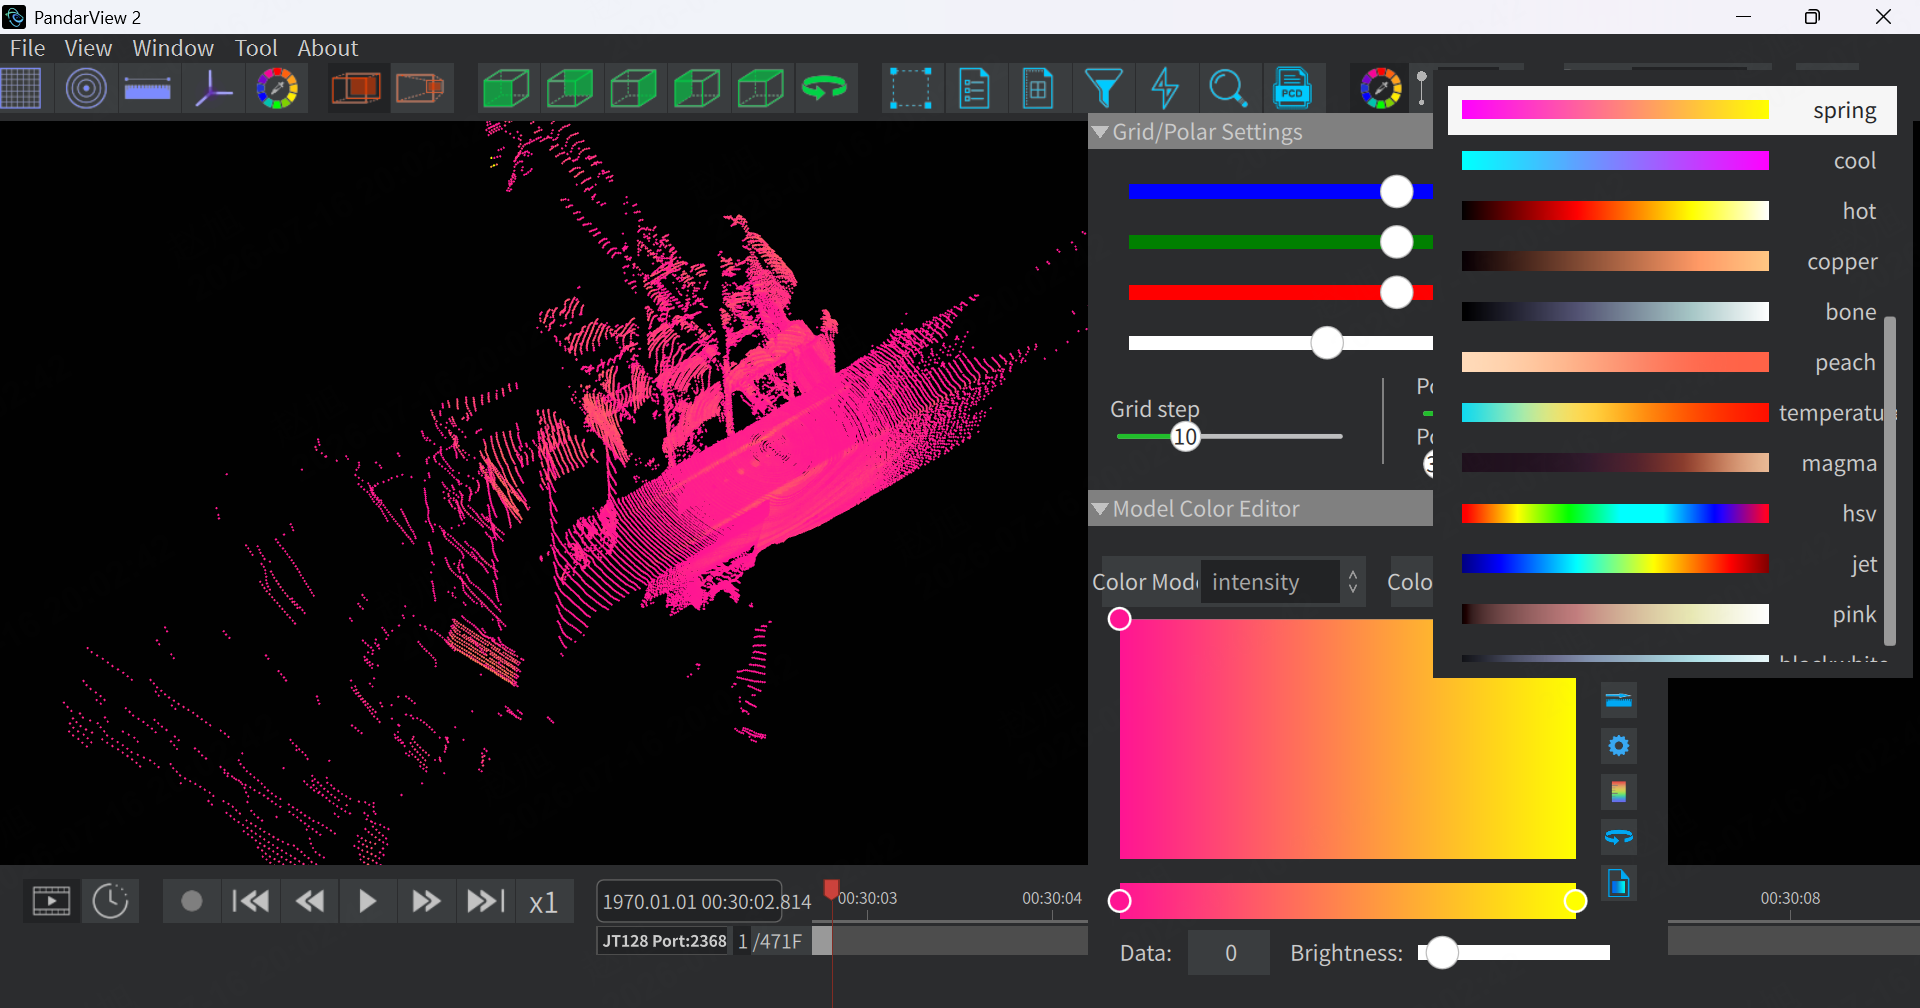
As shown in the figure below, after selecting the 'spring' color type here, the point cloud color will change accordingly:
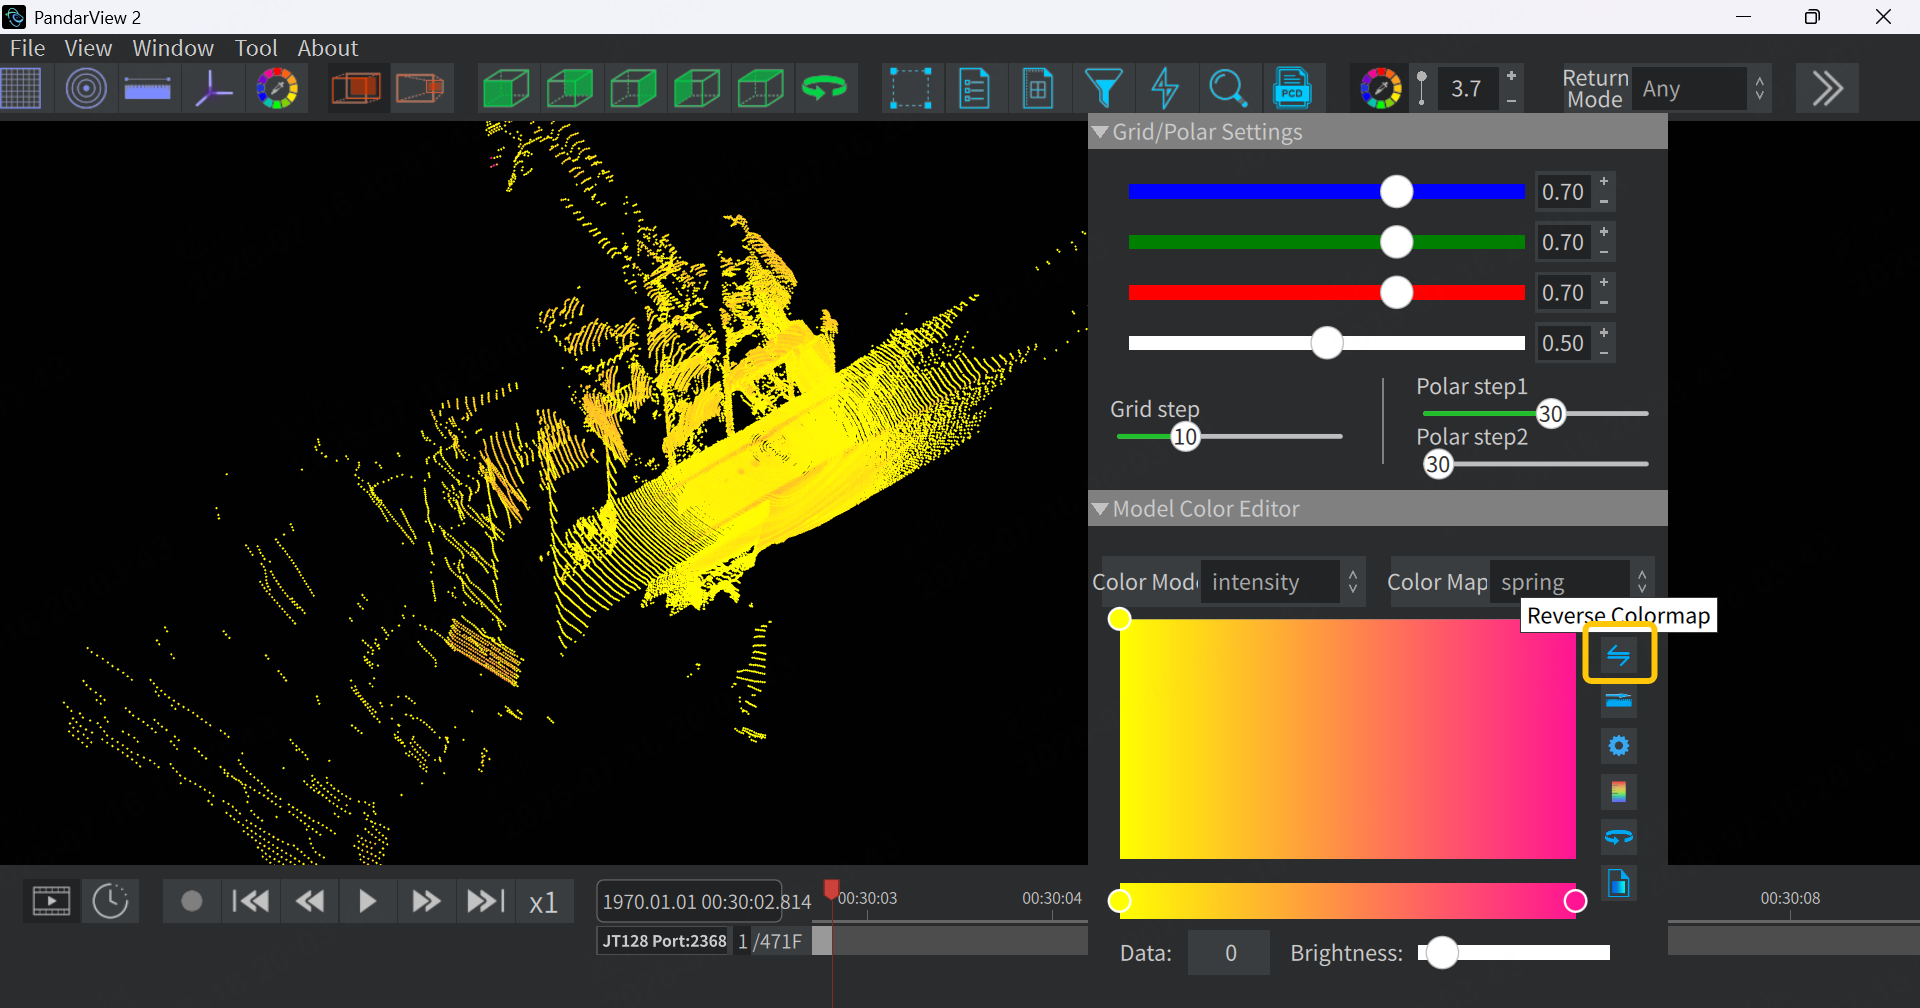
After clicking the highlighted button in the figure below again, the point cloud color is inverted:
2.15 Point Cloud Size Display
As shown in the highlighted options in the figure below, the plus sign increases the point cloud size, and the minus sign decreases the point cloud size.
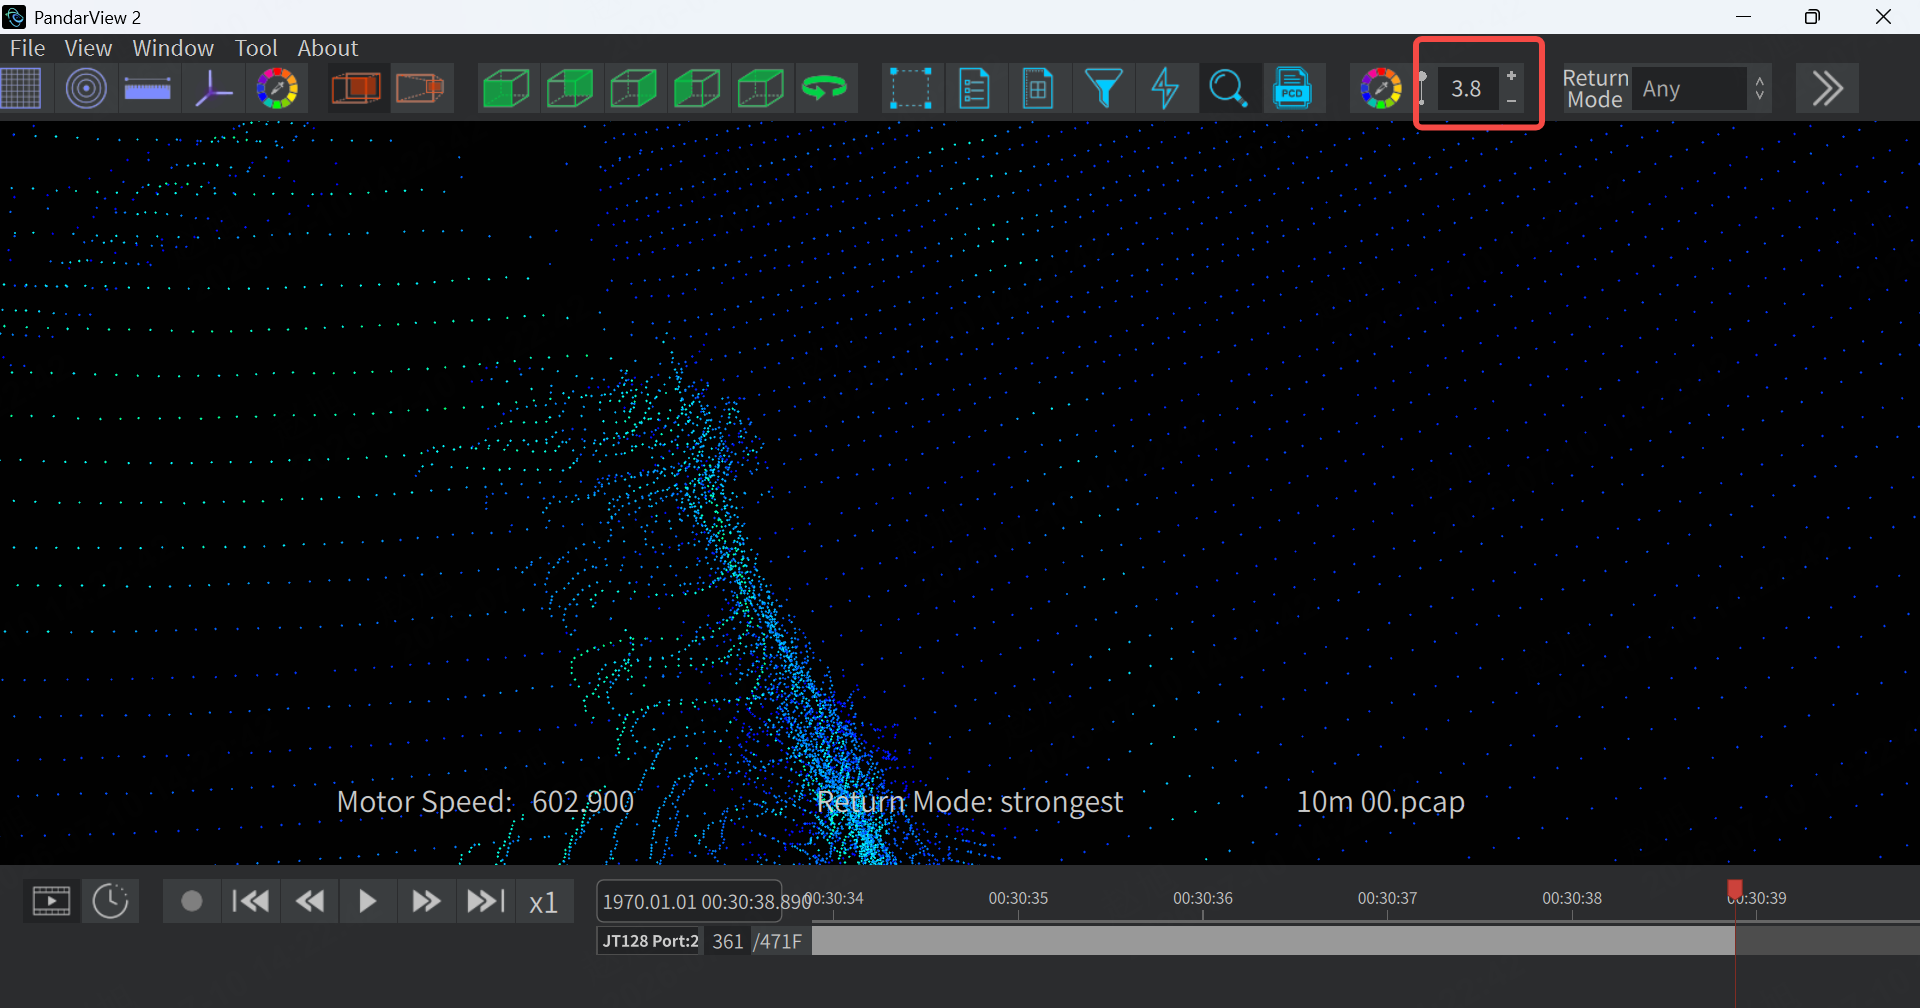
Typically, set this parameter to 3.5 or a larger value will be more convenient for users to observe the point cloud.
2.16 Return Mode Selection
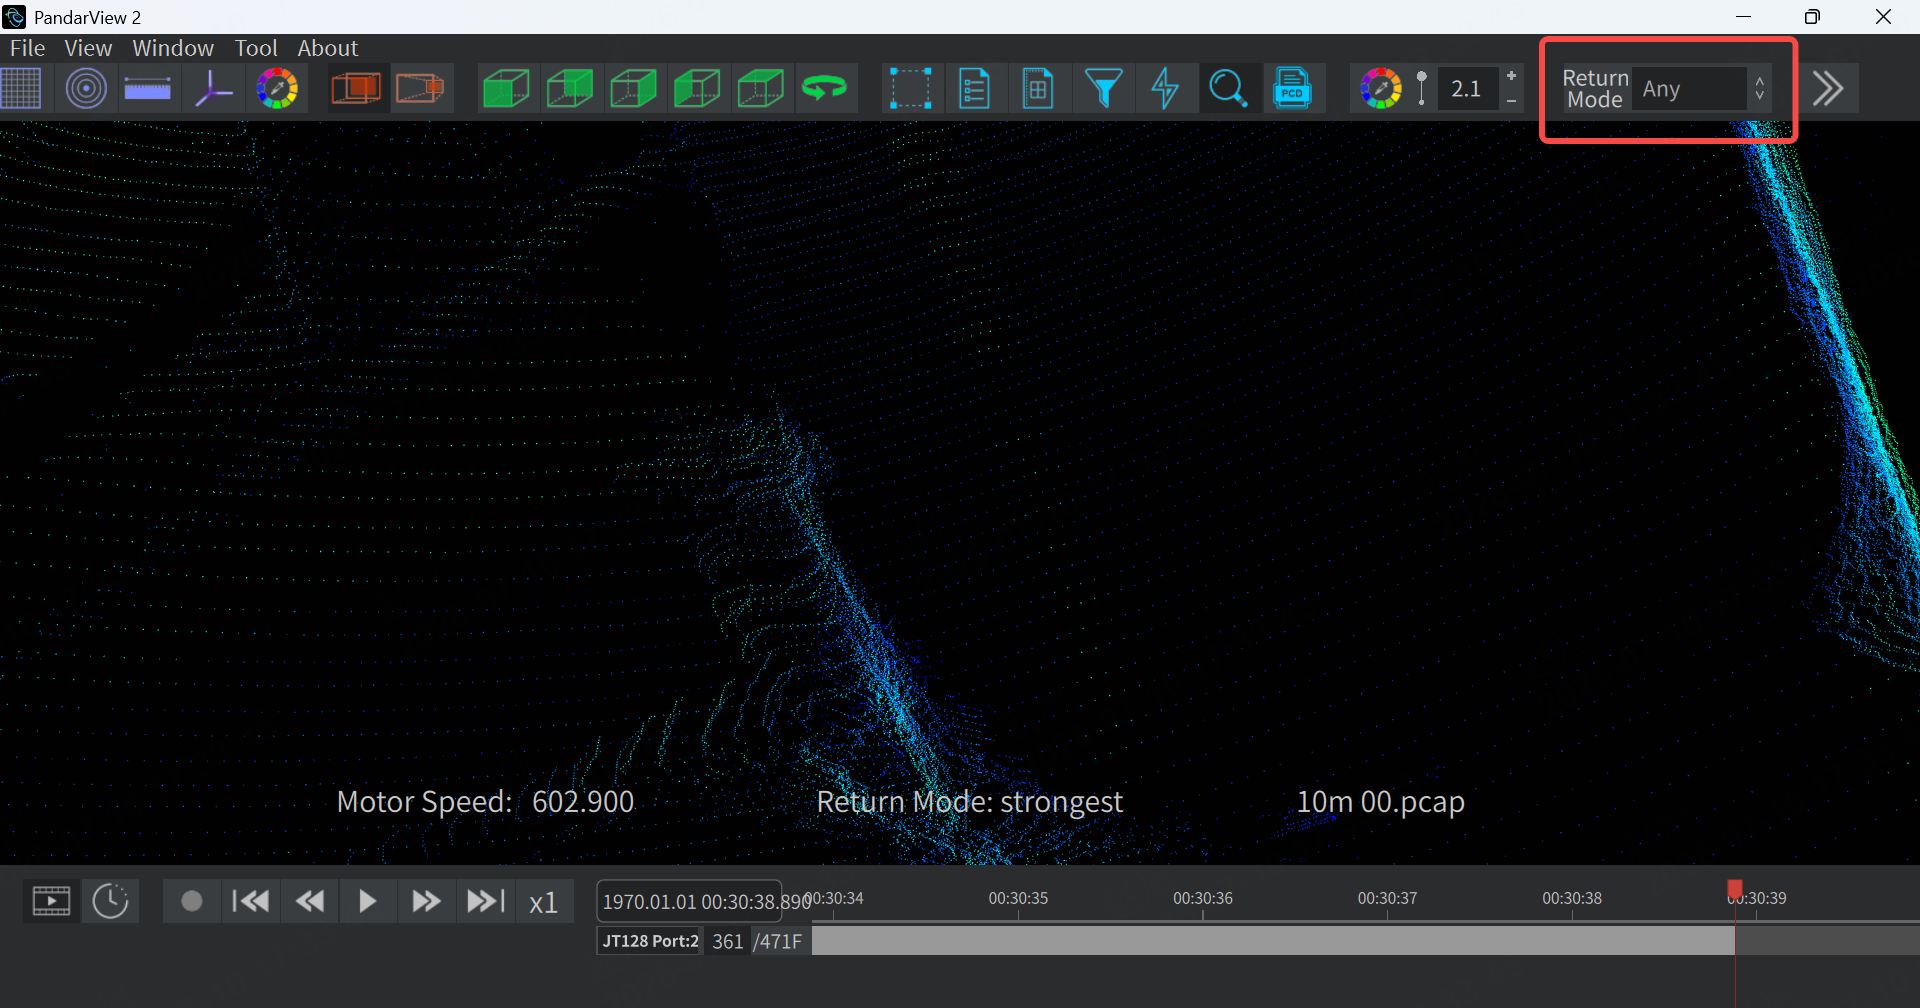
PandarView2 allows real-time selection of point clouds with different echo modes for display.
2.17 Point Cloud Track
As shown below, right-click the time track axis directly below the PandarView2 page to display the following options:

| Option | Description |
|---|---|
| Cut by Time | Trim point cloud by timestamp and save as .pcap file. |
| Cut by Frame | Trim point cloud by frame and save as .pcap file. |
| Export Detail | Export point cloud data for specified frames to a CSV file. |
| Delete Track | Delete the point cloud track. |
| Cancel | Close the menu. |
3 Advanced Operation Instructions —— Toolbox
3.1 General Tools
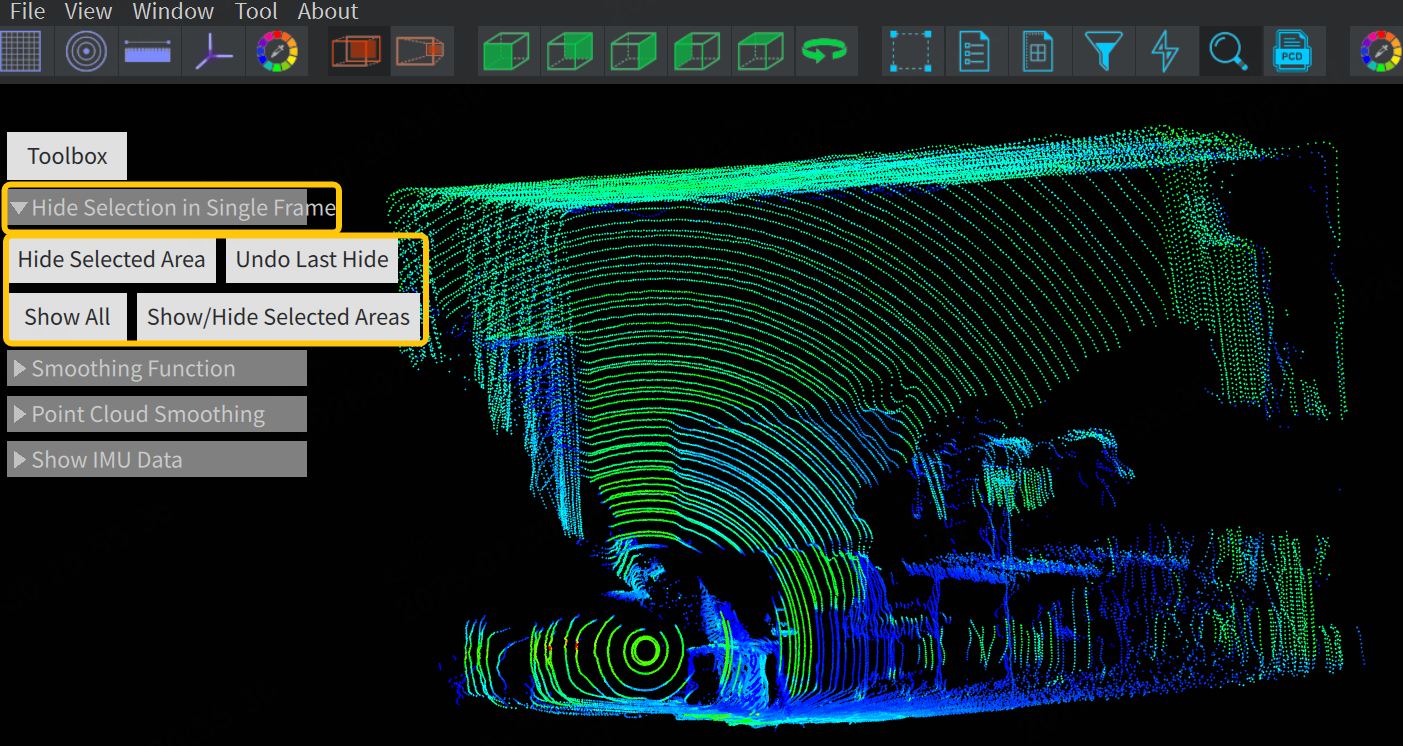
3.1.1 Hide Selection In Single Frame
The PandarView2 Toolbox supports hiding selections for point clouds:
3.1.1.1 Hide Selected Area
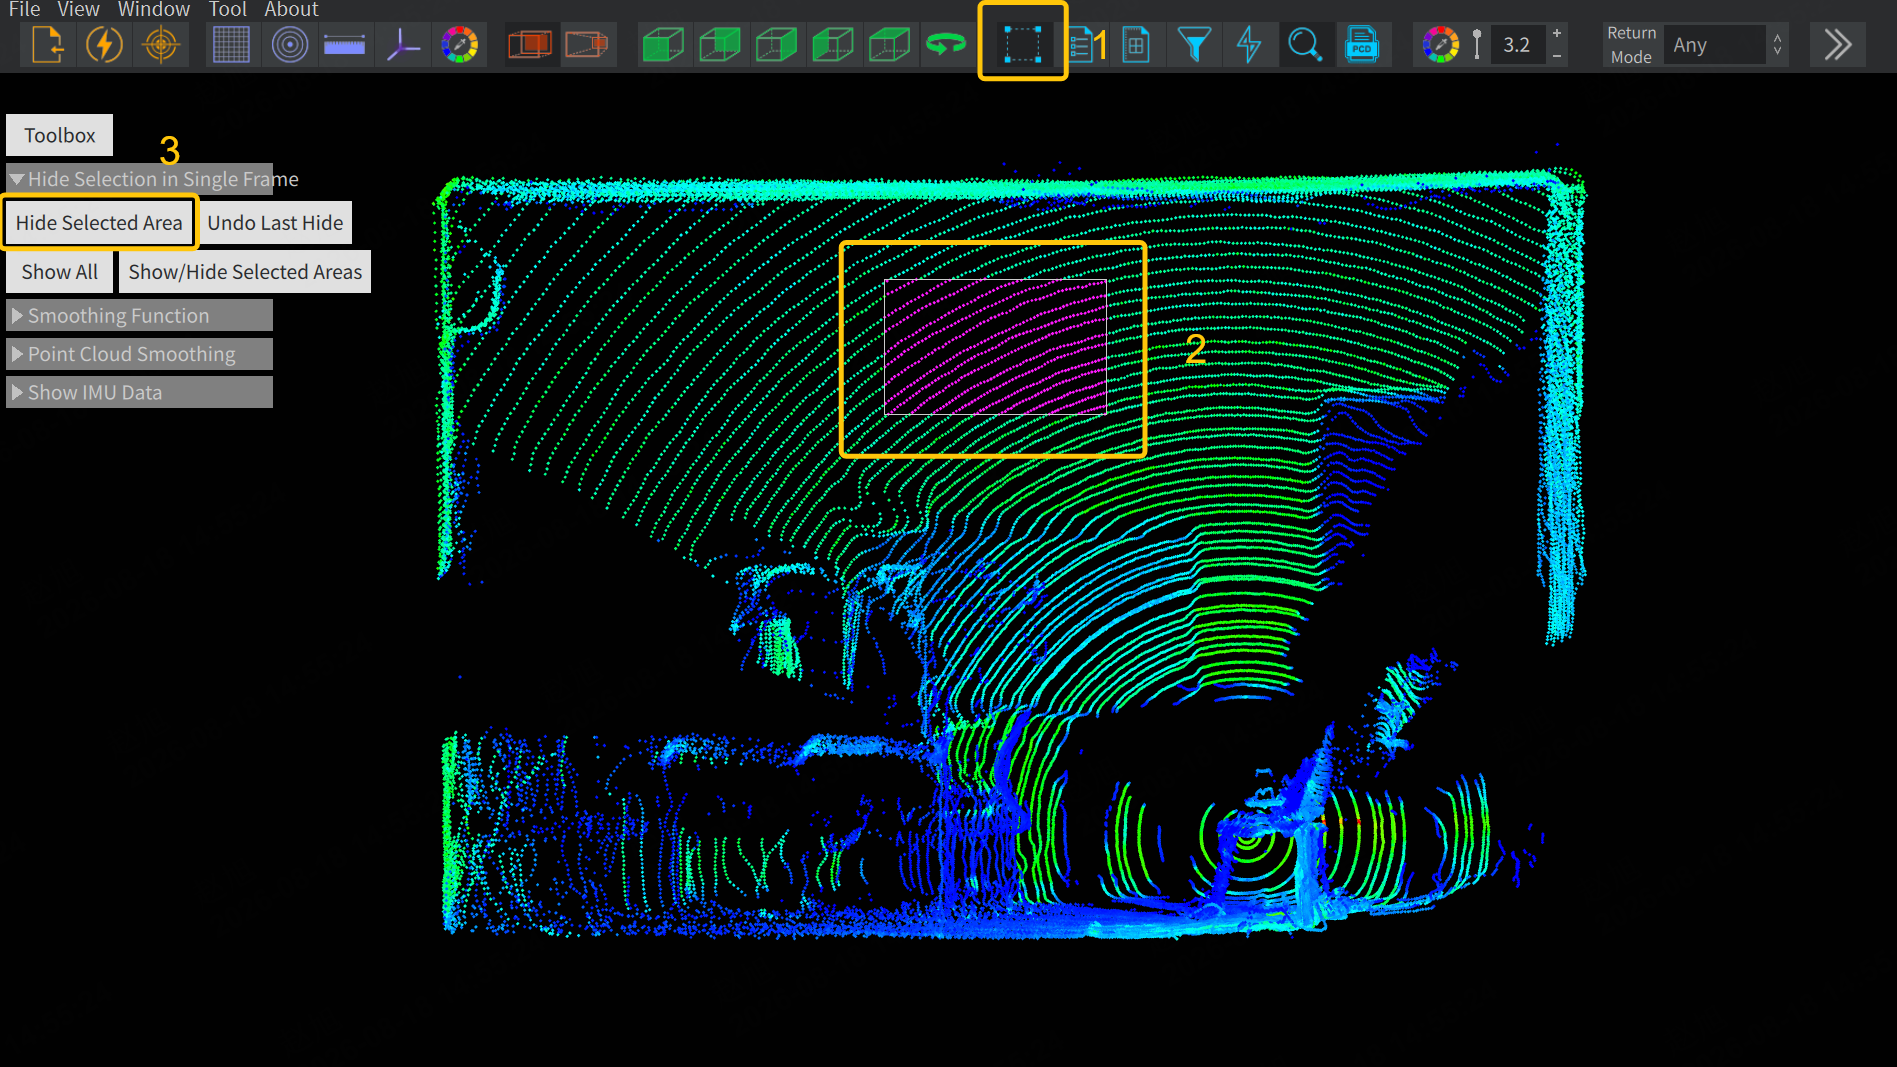
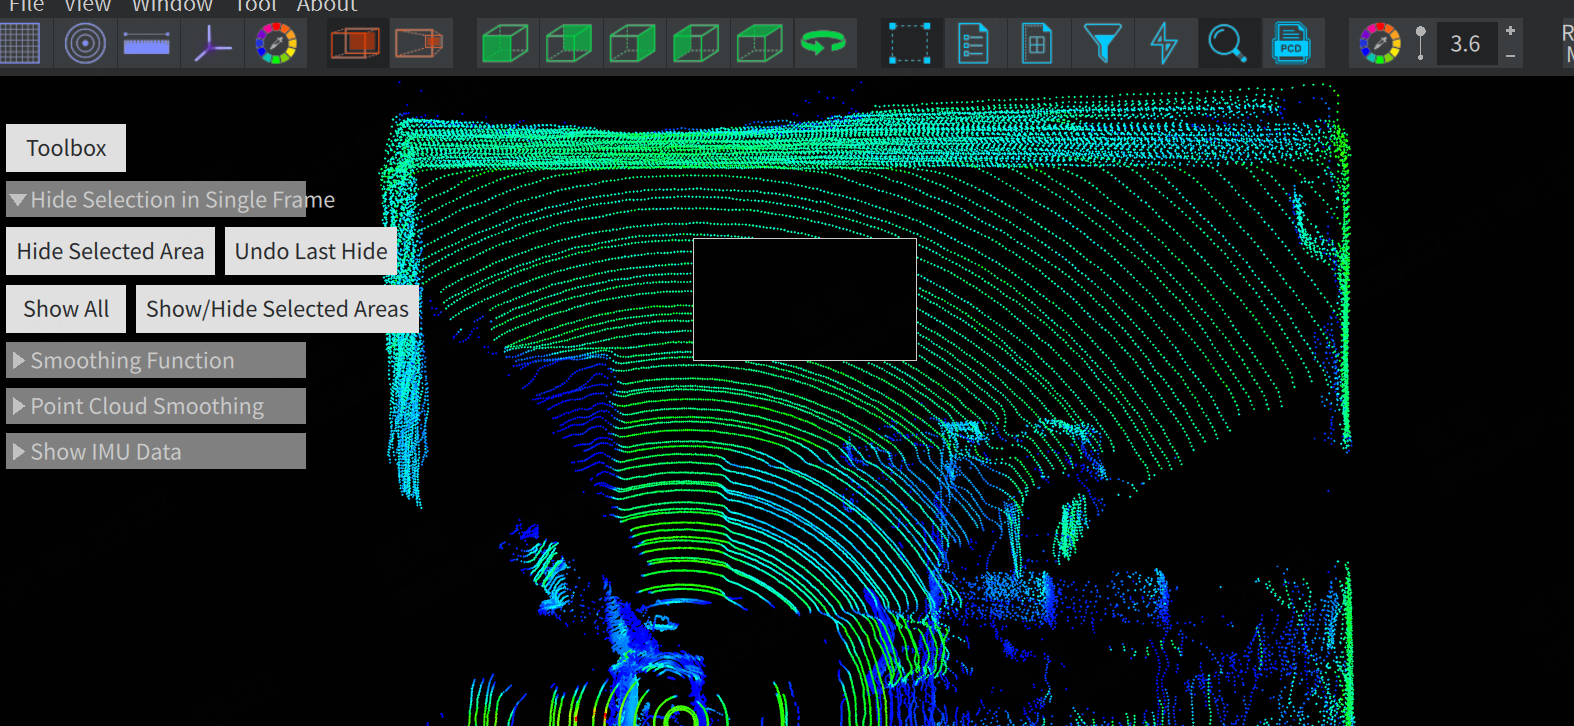
After following the operation steps marked in the figure below, the selected area will be successfully hidden:
| Operation steps | Results |
|---|---|
 |  |
3.1.1.2 Undo Last Hide
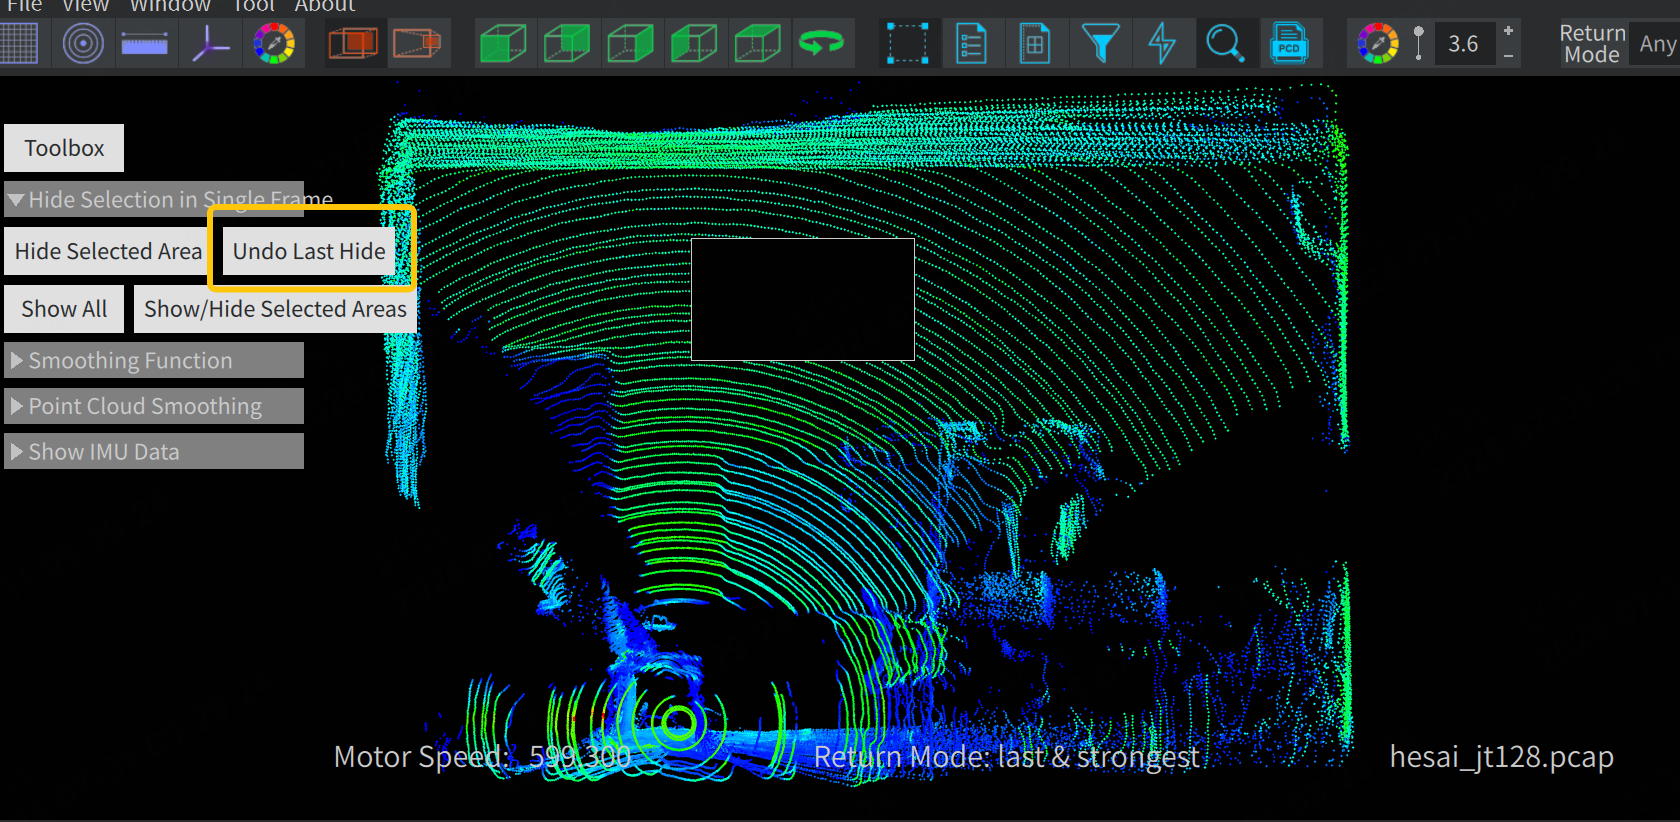
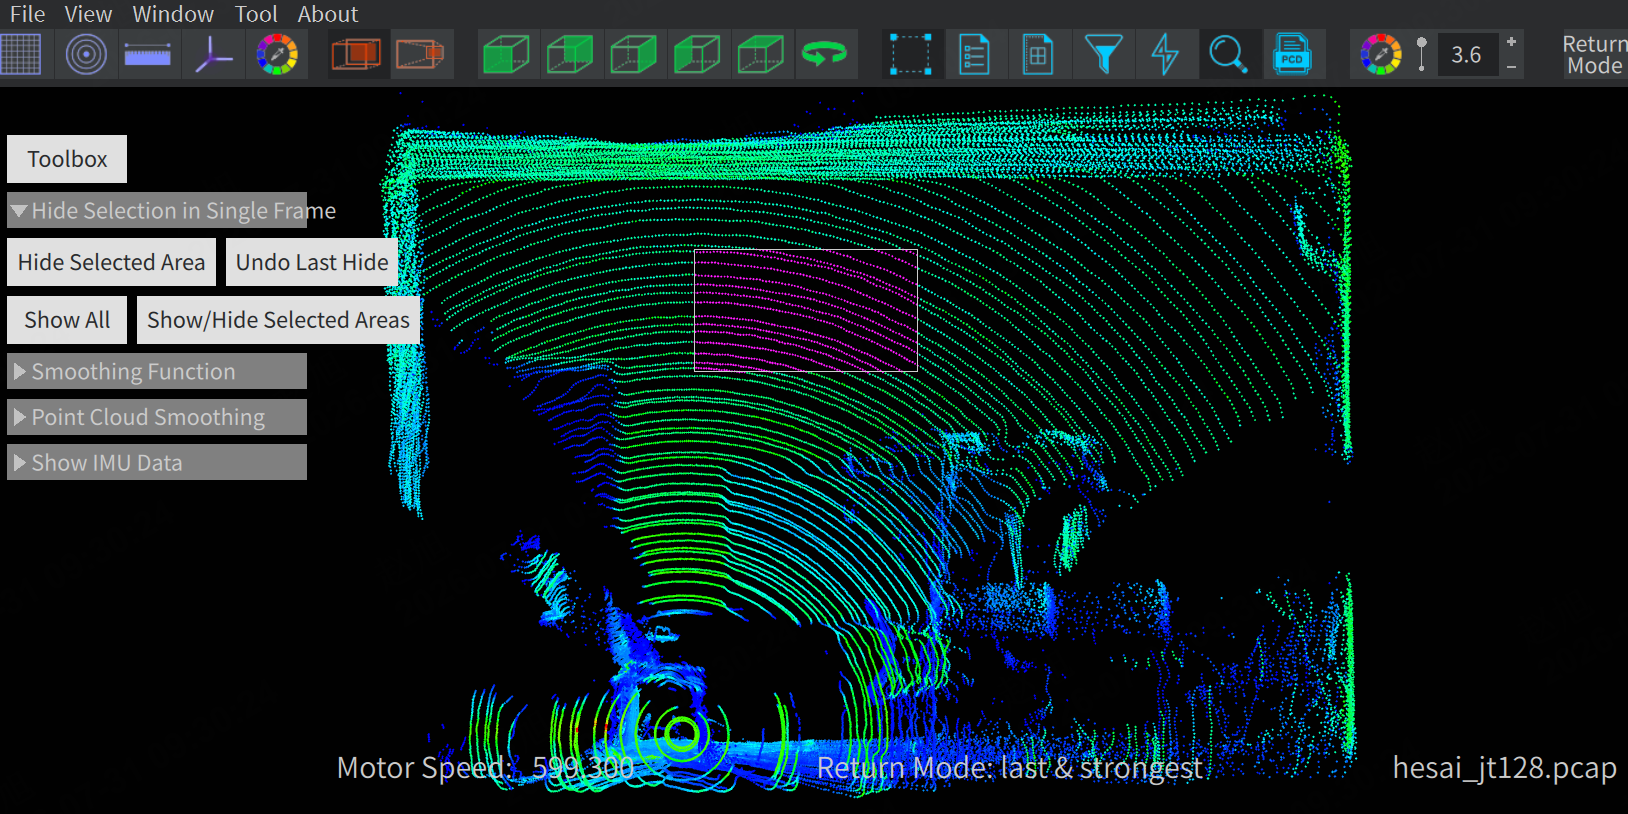
Continuing from the operation of hiding the selected area in 'Hide Selection In Single Frame', click 'Undo Last Hide', and the point cloud hiding operation is undone.
| Operation method | Results |
|---|---|
 |  |
3.1.1.3 Show All
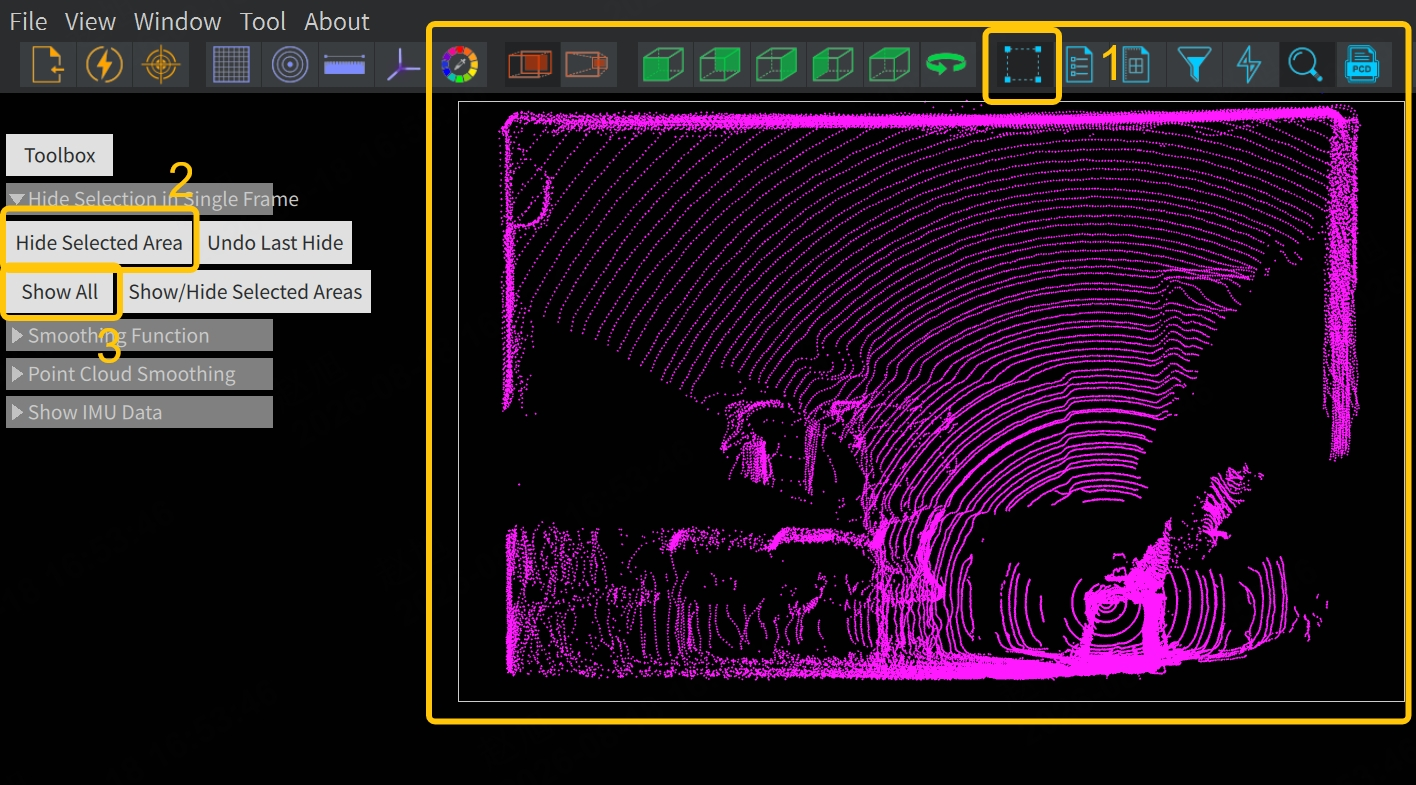
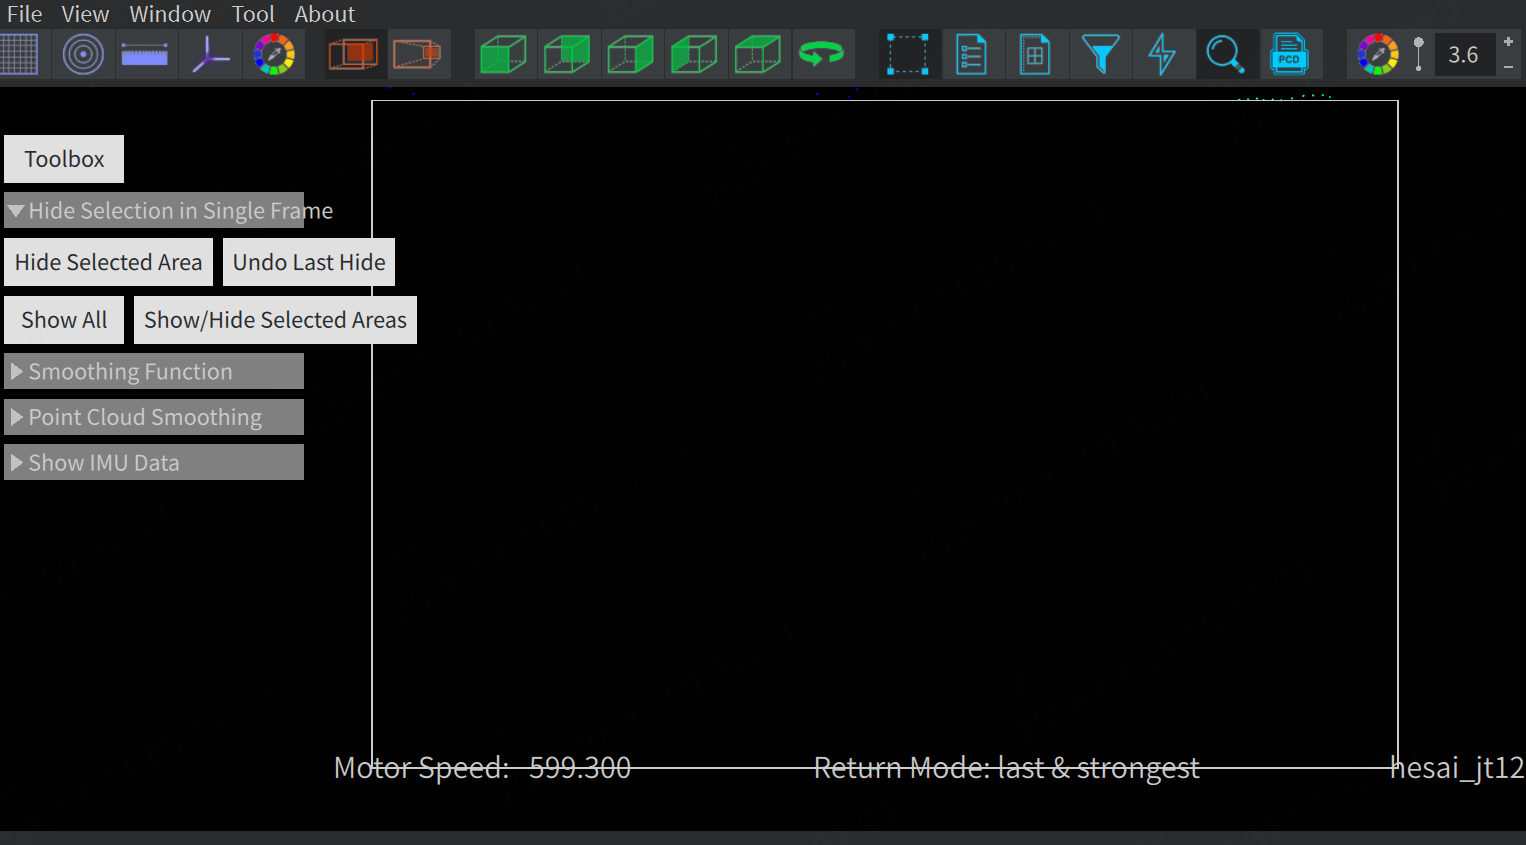
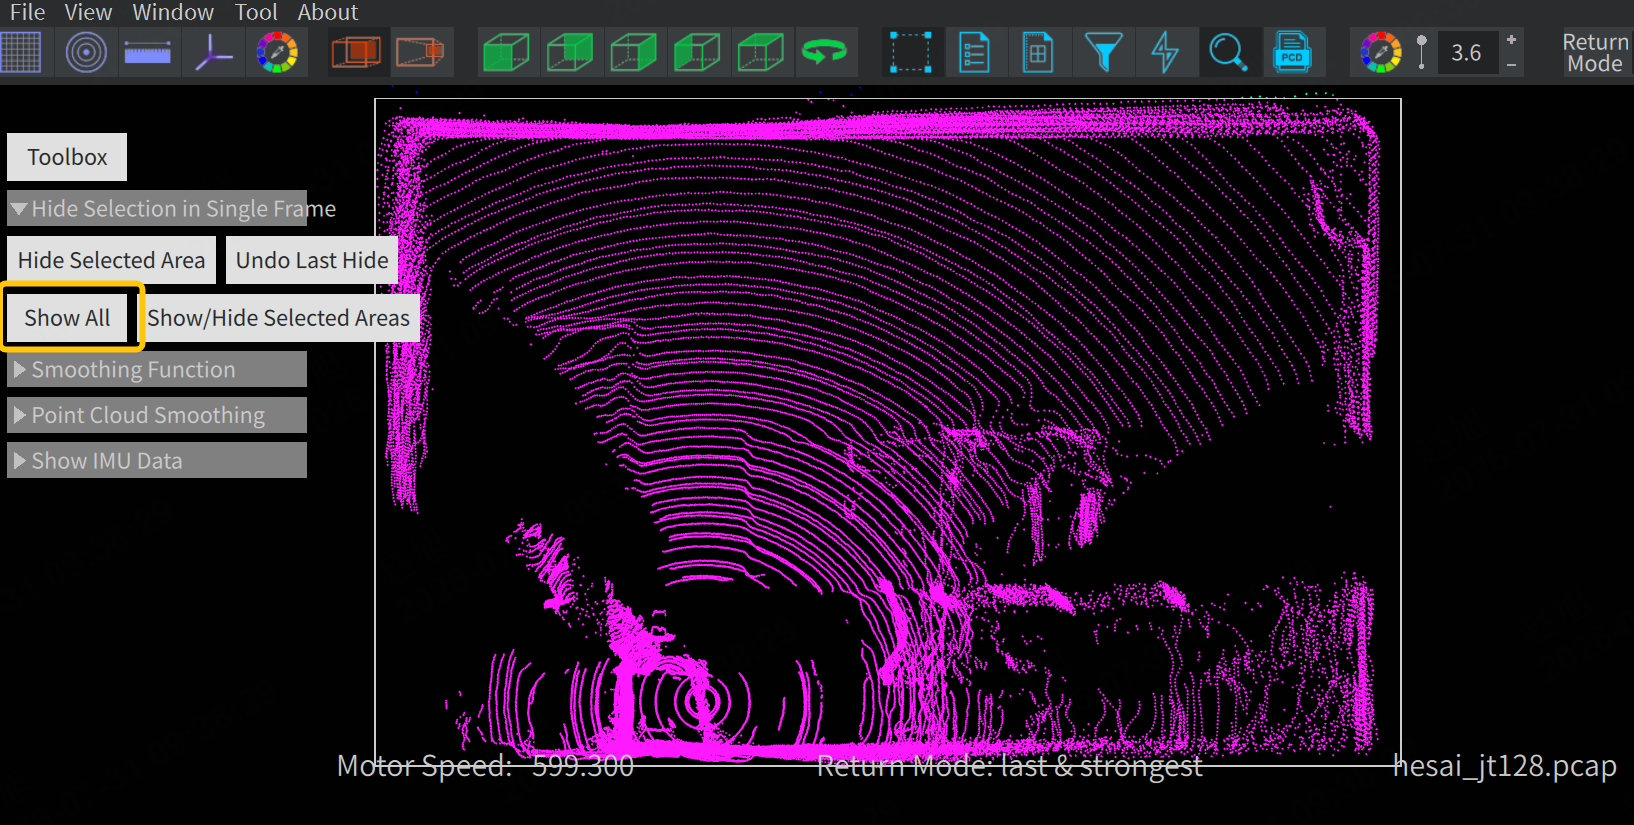
Refer to the steps marked in the figure below: first click the filter box button to select all point clouds, then click Hide Selected Area to hide the selected area, and finally click Show All to display all point clouds.
| Hide all point clouds | Show all point clouds |
|---|---|
 |  |
3.1.2 Show/Hide Selected Areas
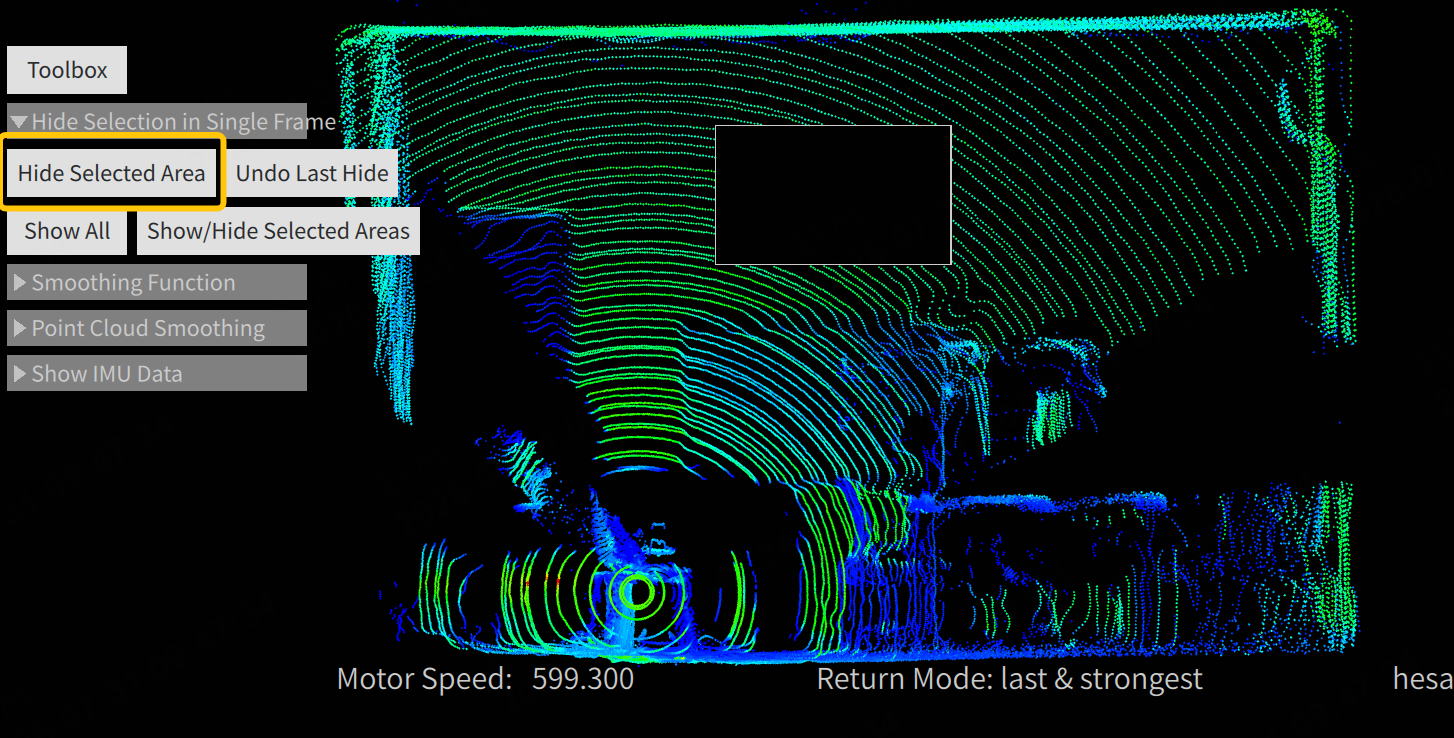
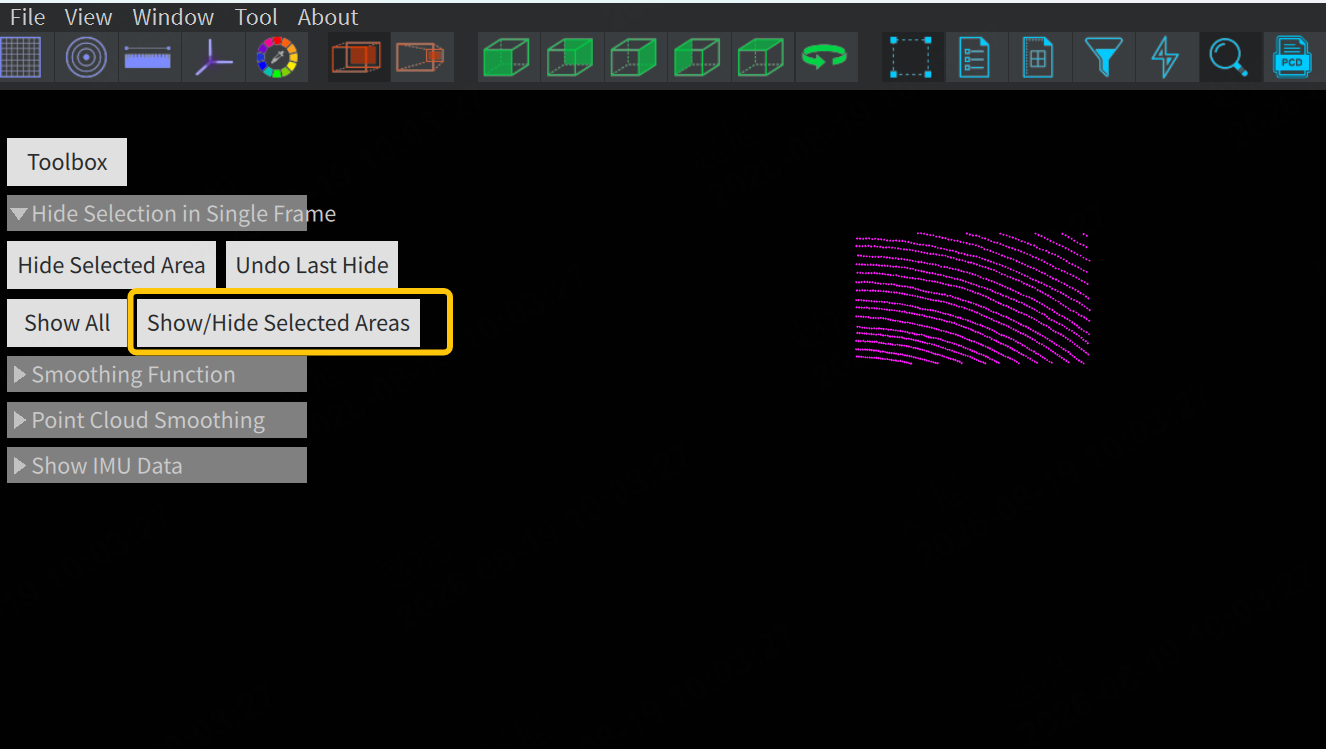
As shown in the figure below, after hiding the point cloud in the selected area, click this button to display only the selected hidden area of the point clouds.
| Hide selected point clouds | Only display the selected point clouds after invert selection |
|---|---|
 |  |
3.2 Special Tools (Only supported by certain models)
3.2.1 Point Cloud Smoothing (JT128 / QT128)
This tool supports searching for neighboring points around each point in space and performs mean smoothing in order to reduce ranging jitter, making the point cloud visually smoother, and filtering abnormal stray points. The comparison before and after enabling is shown in the figure below:
| Before Enabling | After Enabling |
|---|---|
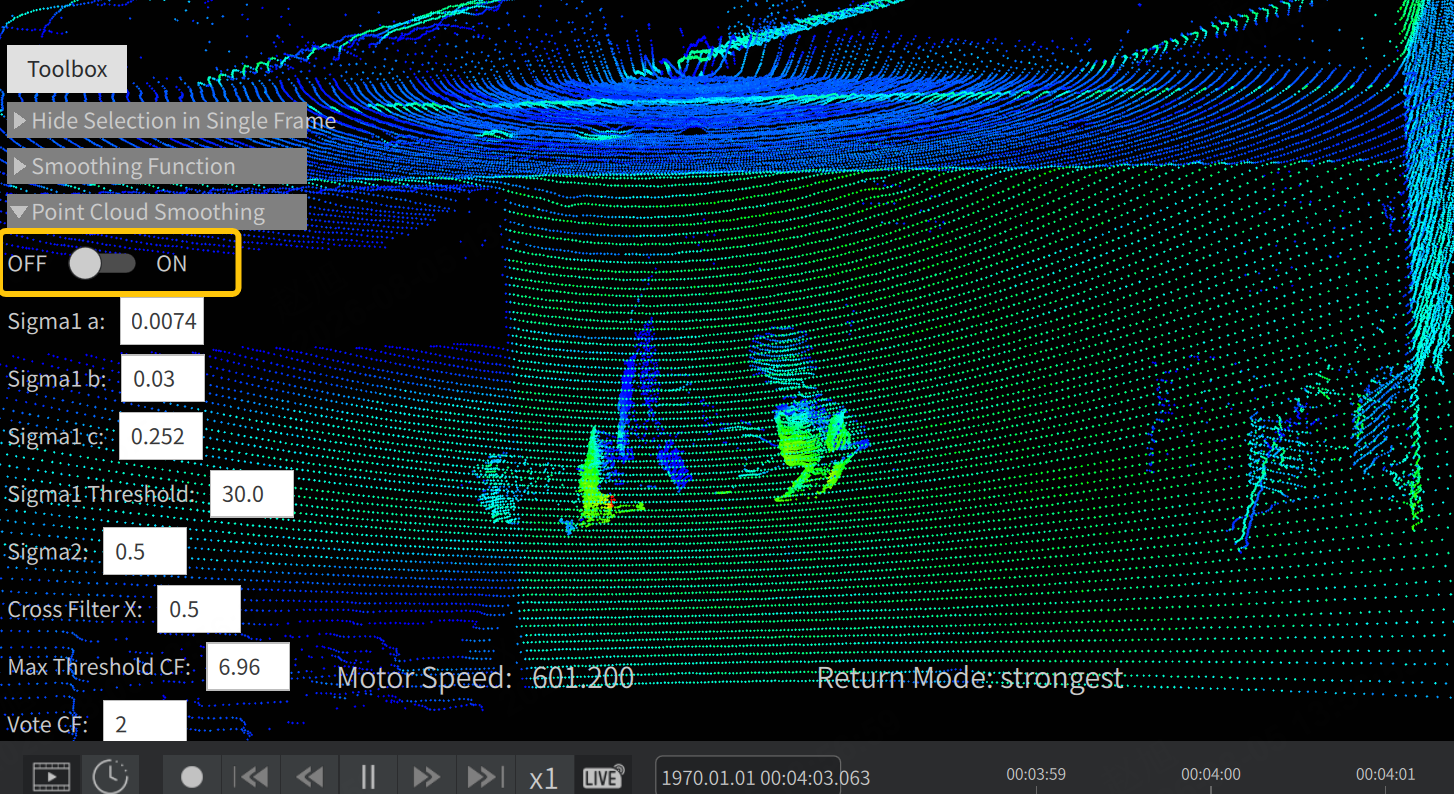 | 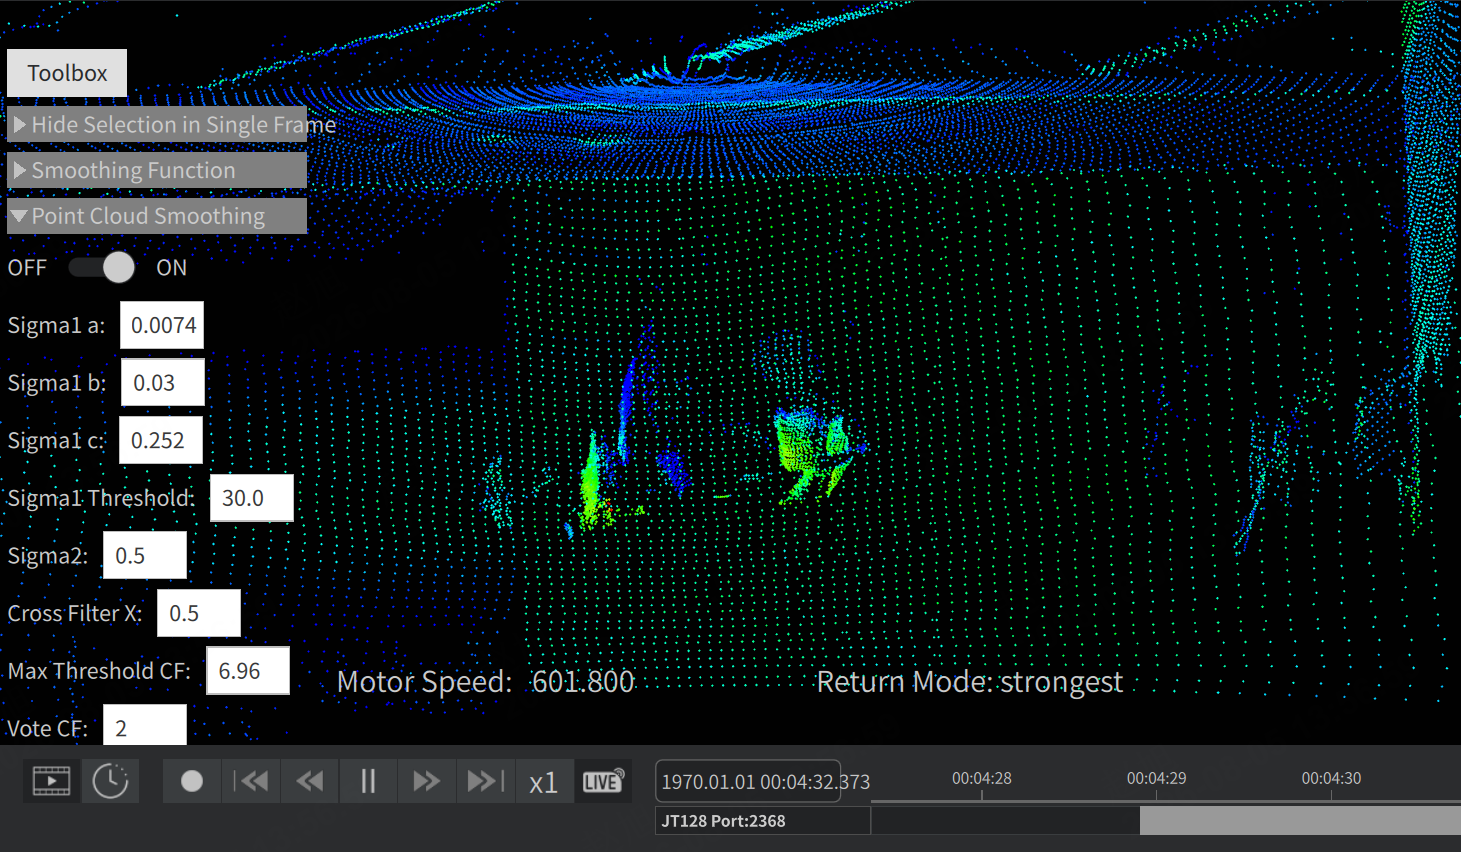 |
Note: Only JT128 and QT128 support this function!
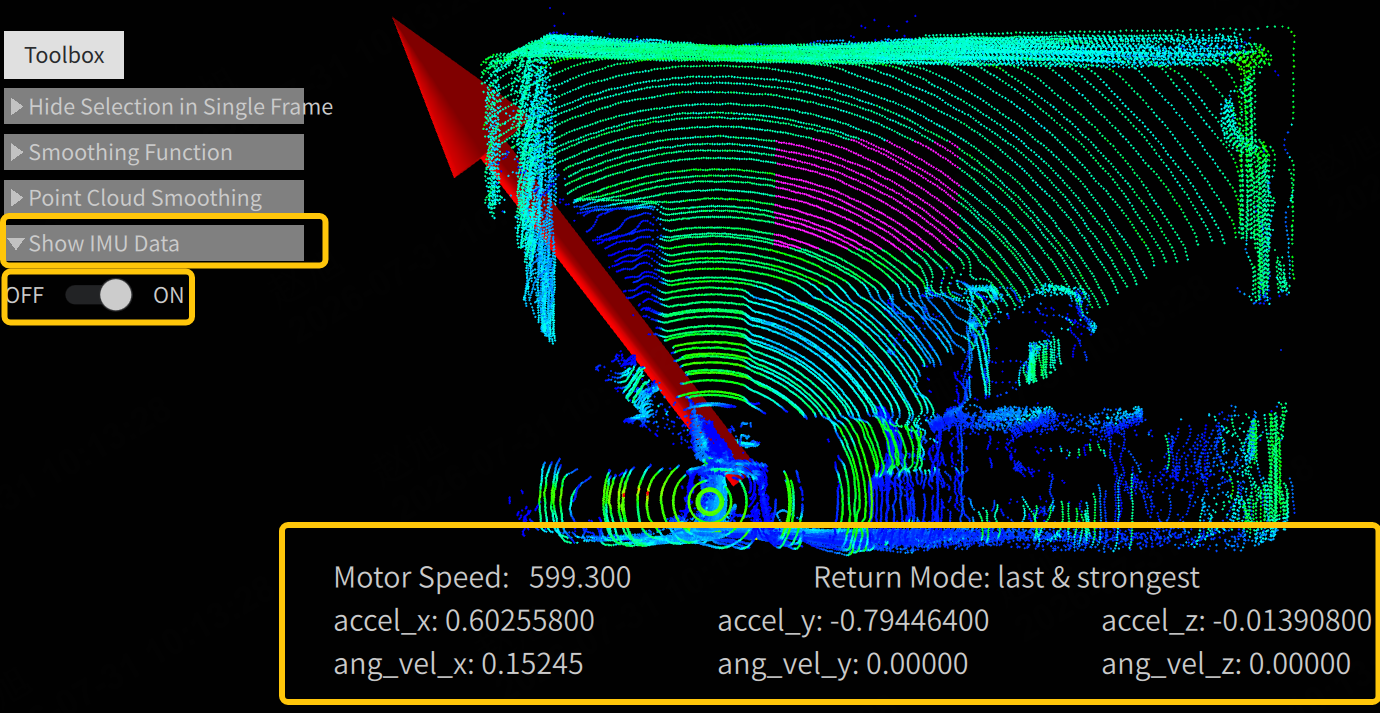
3.2.2 Show IMU Data (OT128 / JT128 / JT16)
After turning on the Show IMU Data switch framed in the figure below, click it again, and a red arrow will appear in the point cloud window, representing the orientation of the IMU data coordinate system, and the IMU data will be displayed below the point cloud:
Note: Only JT16, JT128 and OT128 support this function!
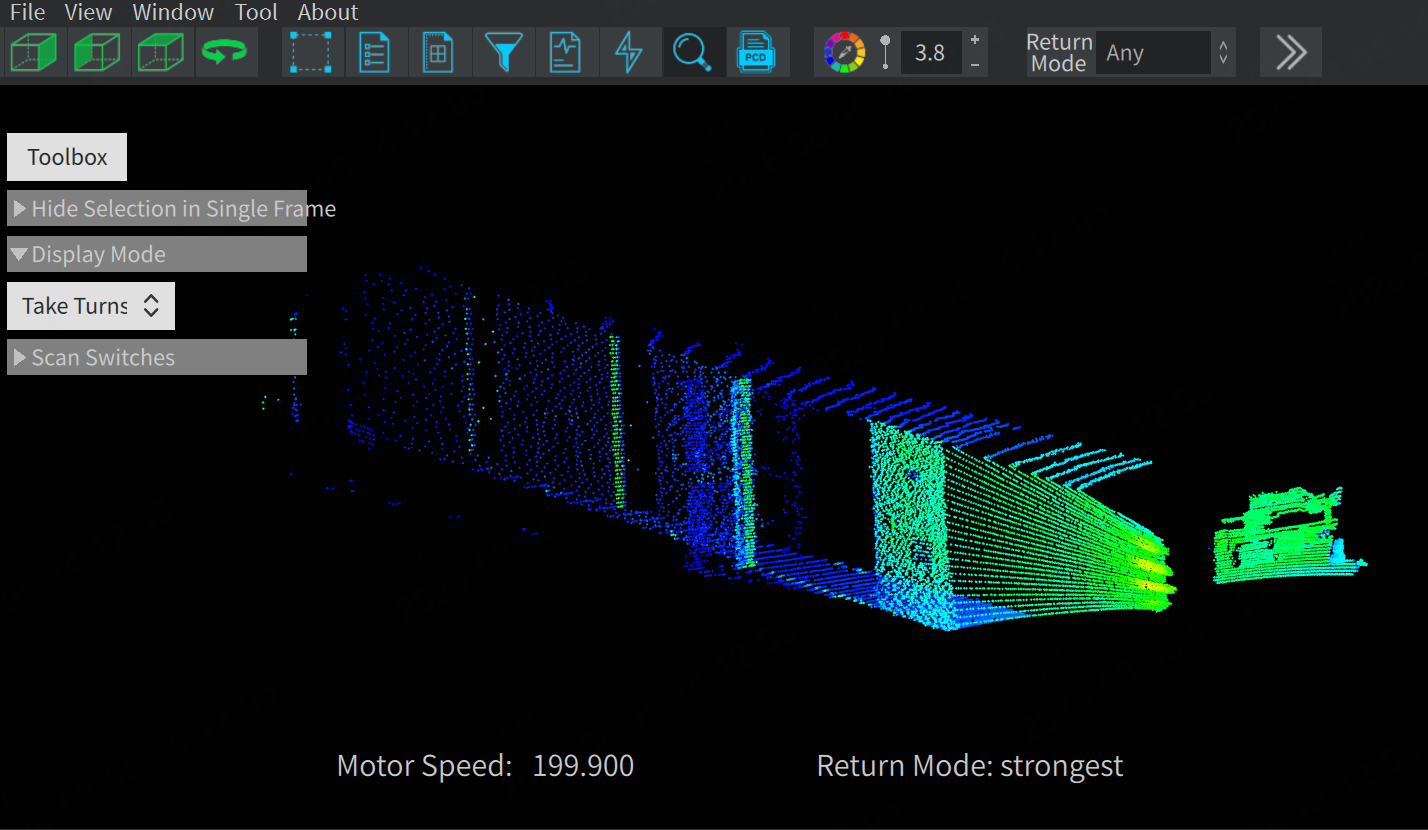
3.2.3 Display Mode (AT128P)
AT128P's laser scanning involves 3 reflective mirrors. This tool controls the stitching/frame splitting logic of the point clouds from the 3 sets of mirrors, with a total of 3 modes:
-
Take Turns (default mode): The screen alternately displays the point cloud of a single mirror without stitching, which is suitable for individually checking the scanning quality and channel consistency of each mirror, as shown in the figure below:
-
Tradition: The data of the three mirrors are merged into a single frame, which is rarely used in daily debugging. Compared with the default mode, the point clouds in the traditional mode show a mirror-like effect.
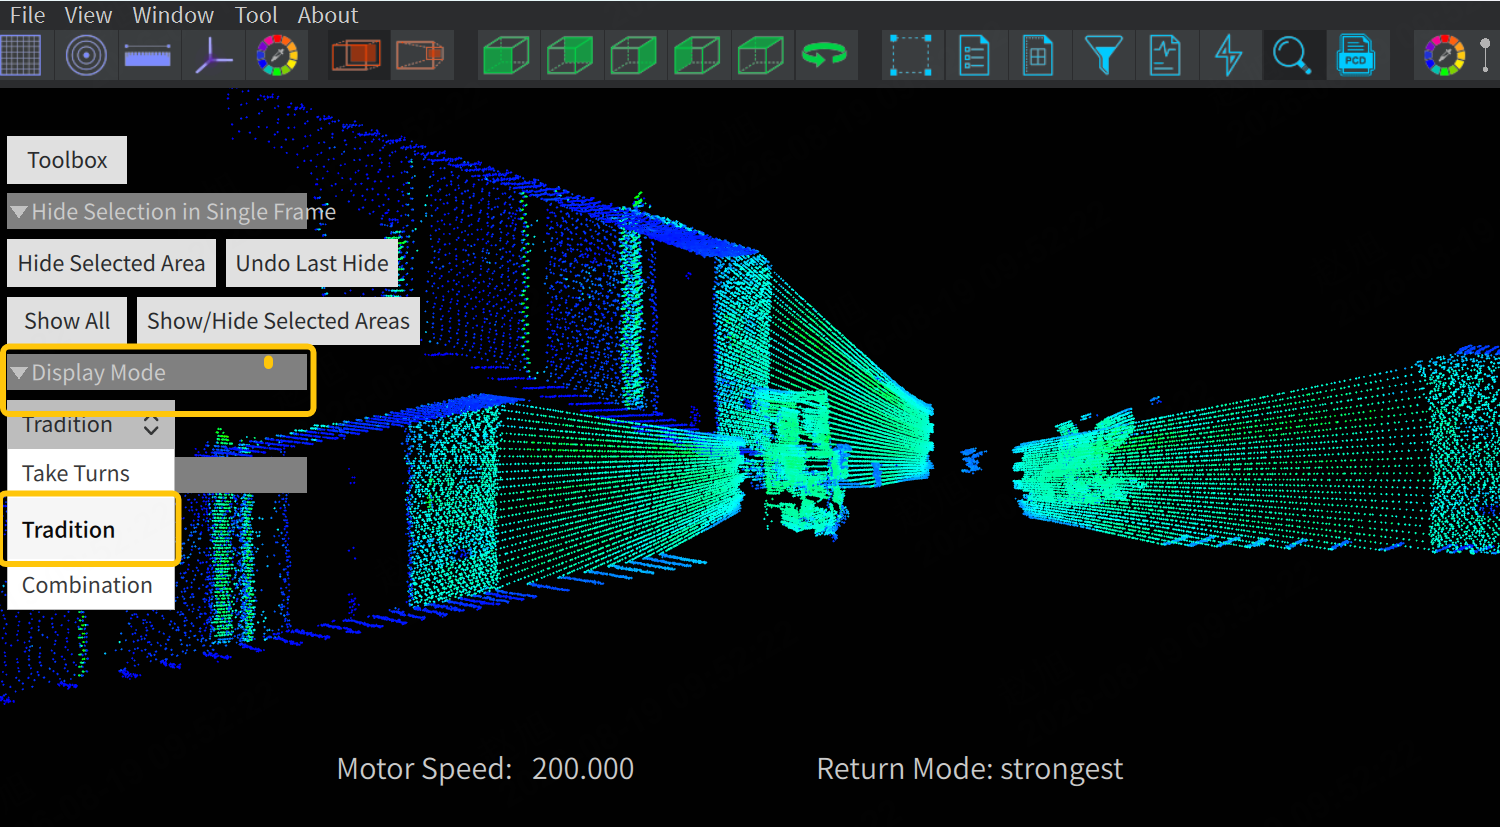
-
Combination: Stitch and fuse the point clouds scanned by the 3 mirrors into a complete frame. Compared with the default mode, the point cloud in the combination mode is denser due to point overlapping.
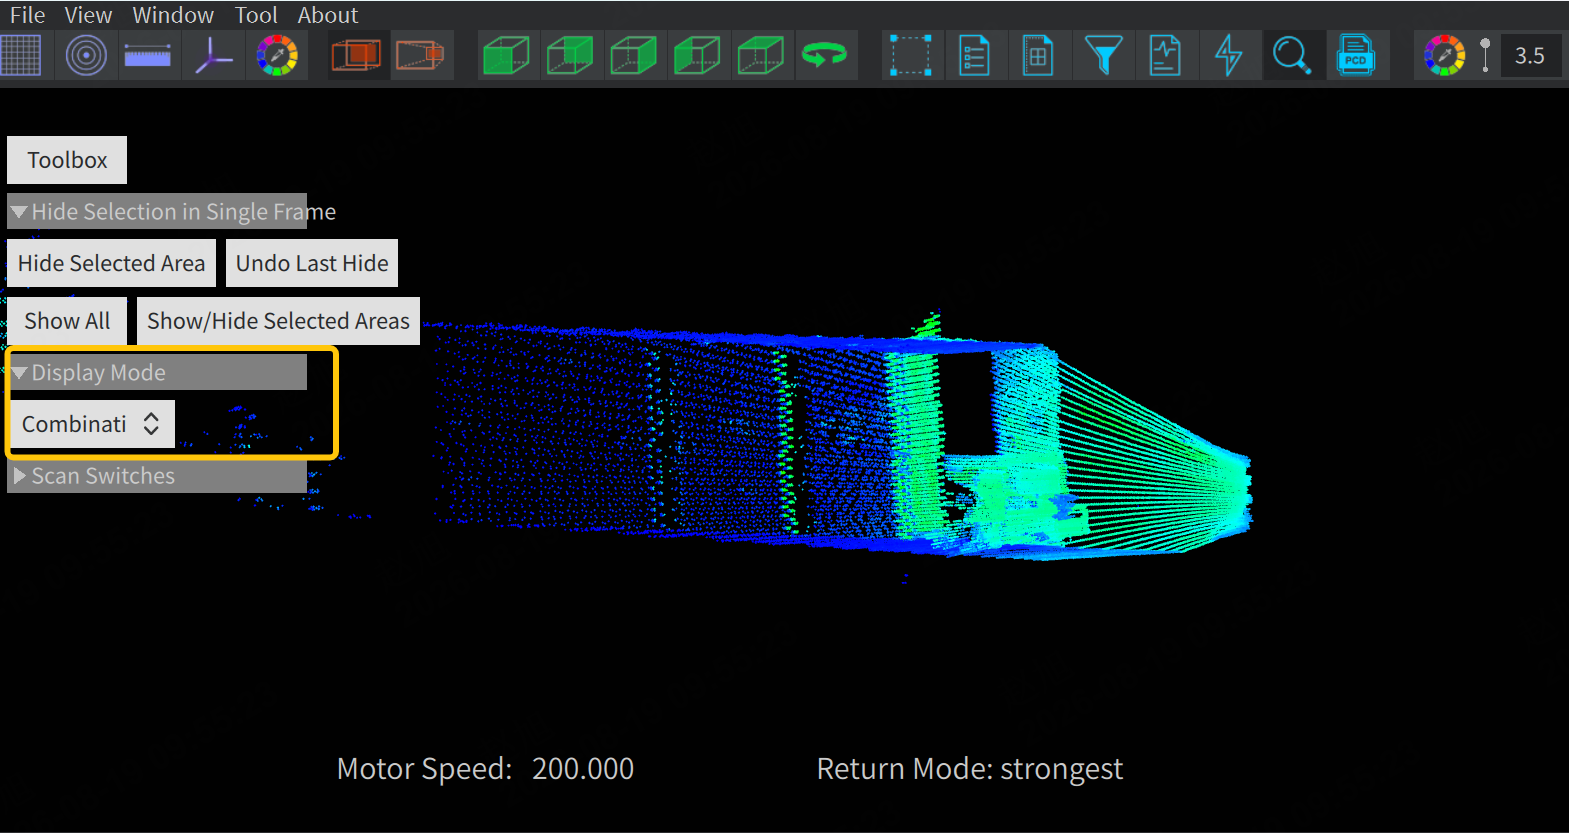
Note: Only AT128P supports this function!
3.2.4 Scan Switches (AT128P)
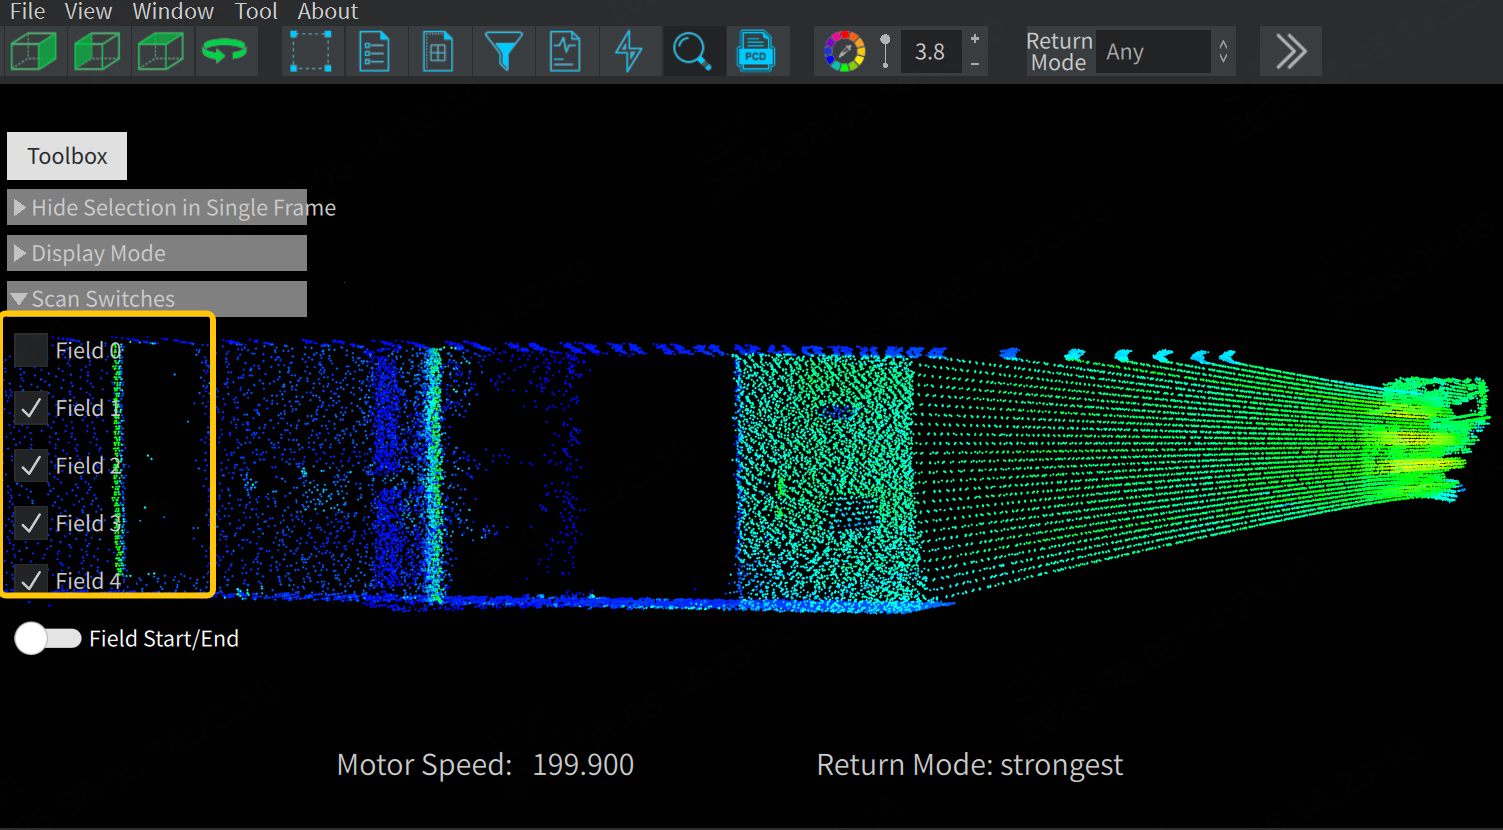
After enabling the Combination mode in Display Mode, the point cloud consists of three channels. Click Scan Switches to expand the checkboxes for 5 scan fields (Field 0~4), which are used to uniformly crop the horizontal scanning angle.
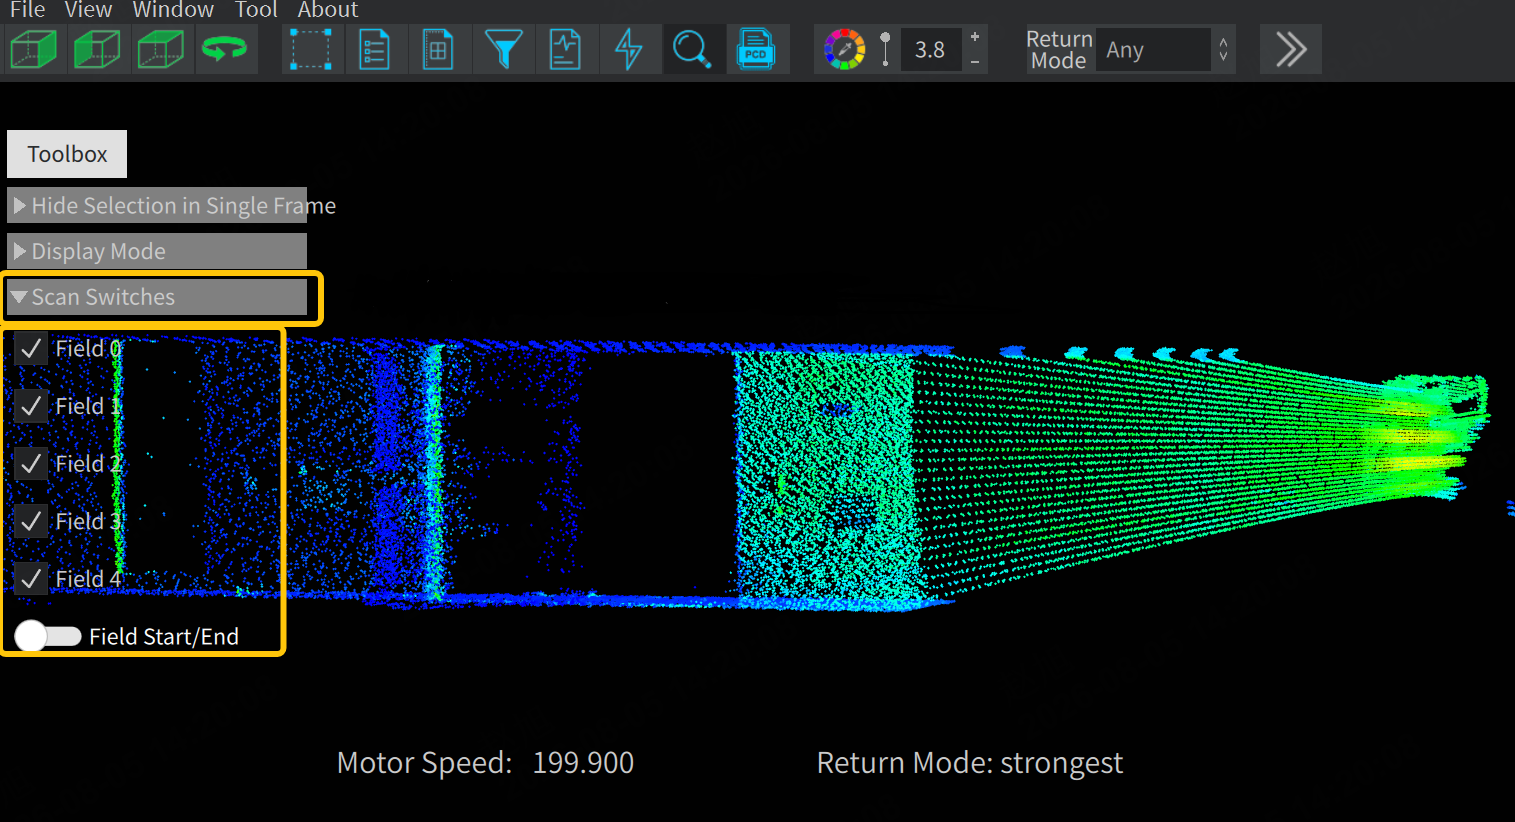
3.2.4.1 Field 0 / 1 / 2 / 3 / 4 Checkboxes
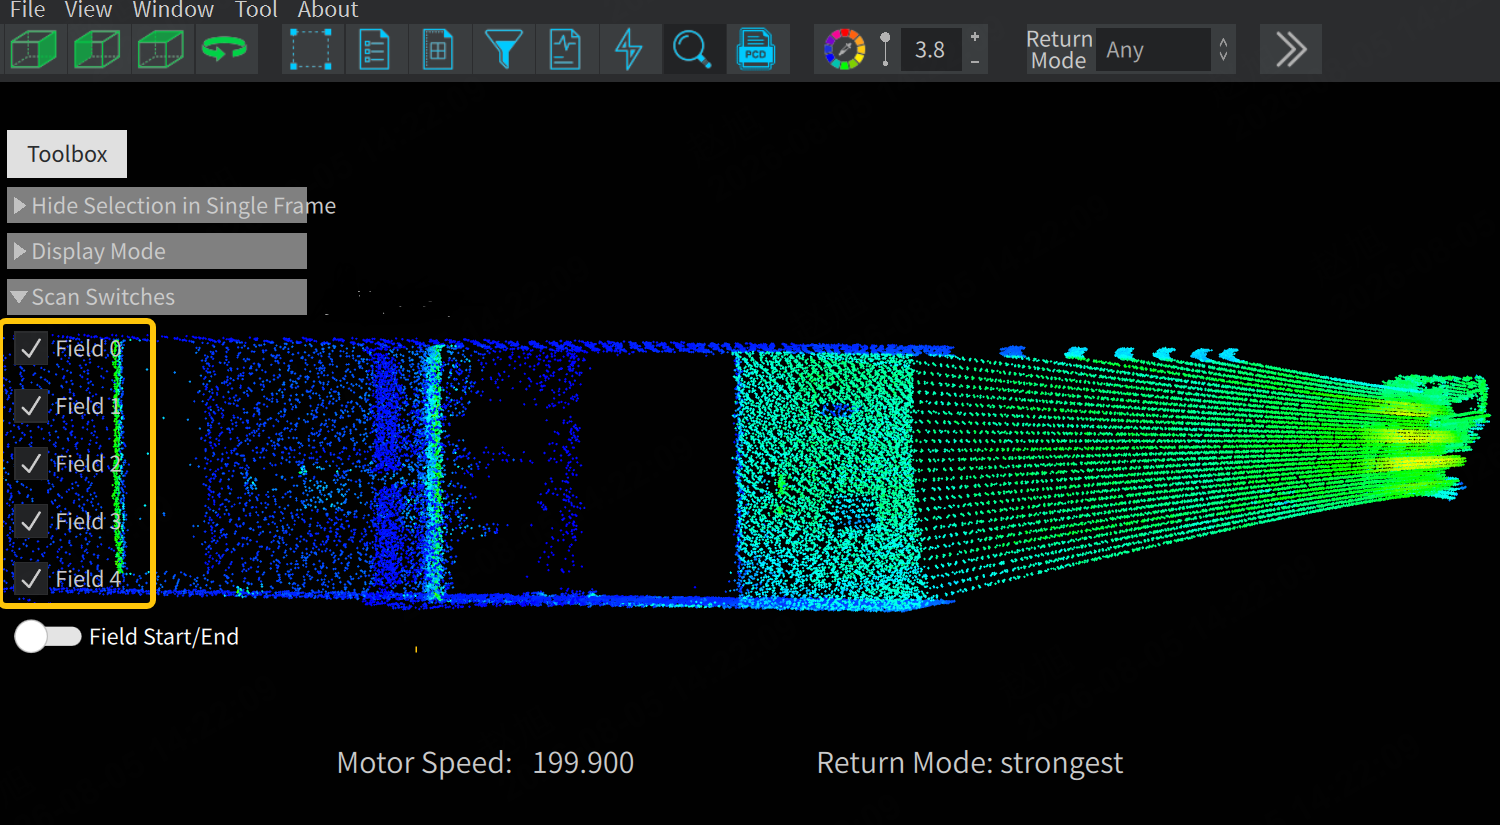
Uniformly crop the horizontal scanning angle for the 5 scan fields (Field 0~4), only retain the point cloud within the set interval, and filter out the point cloud of the remaining channels.
- Selected: The screen displays all point clouds of this group of laser beams;
- Unselected: Directly hide this group of laser beams from the screen.
| All channels enabled | One channel is hidden |
|---|---|
 |  |
3.2.4.2 Field Start/End Settings
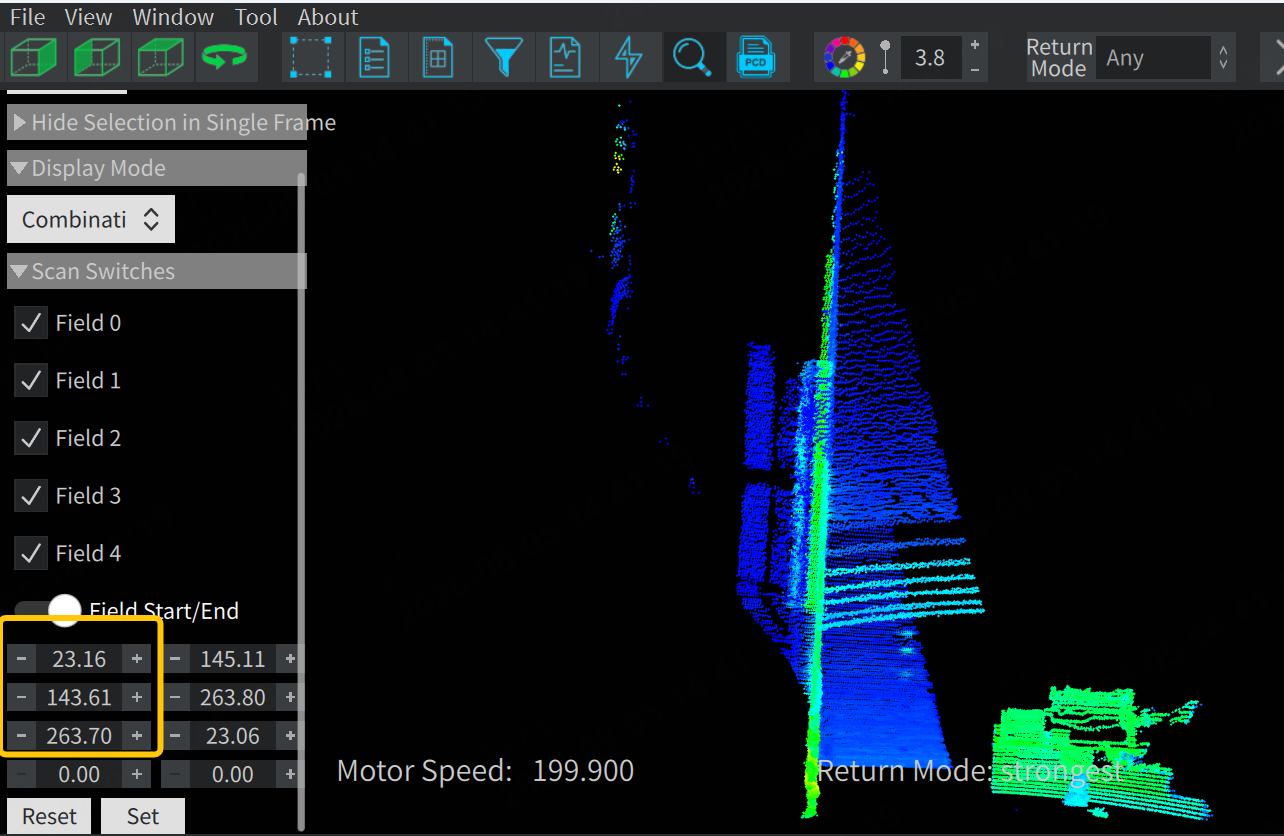
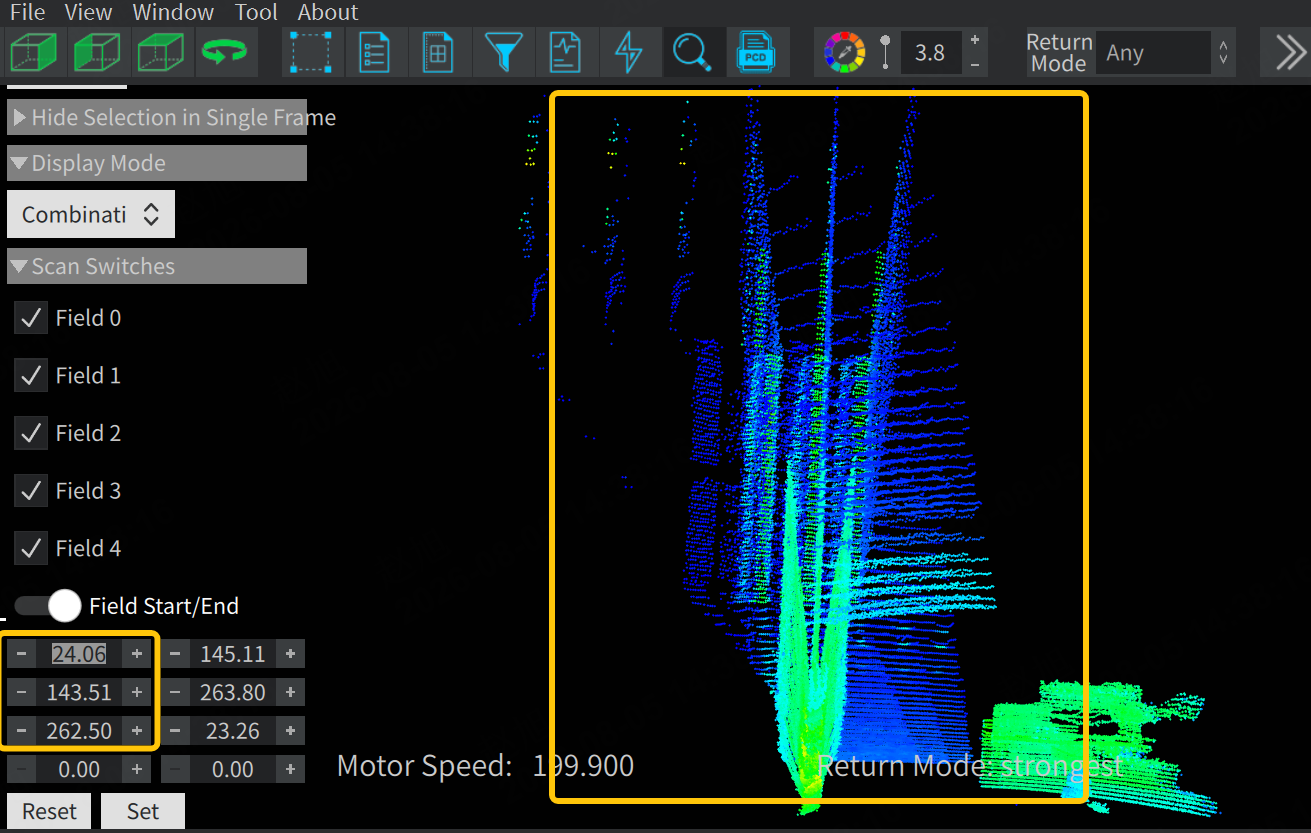
After enabling the Combination mode in Display Mode, the point cloud consists of three channels. This setting controls the start angle and end angle of each group of scanning laser beams.
When this switch is turned ON, user can limit the point cloud to only display data within the interval of "start angle ~ end angle". The three rows marked in the figure correspond to one point cloud mirror each. Adjust the values to observe the point clouds of the three mirrors. The corresponding effect is shown in the comparison figures as below:
| Before adjustment | After adjustment |
|---|---|
 |  |
Note: Only AT128P supports this function!
4 Common PandarView Troubleshooting
4.1 Point Cloud Real-time Streaming Display
4.1.1 Point cloud not displayed
-
Ensure the host computer's firewall is disabled or allow the PandarView2 program through the firewall.
-
Check lidar Ethernet parameter settings
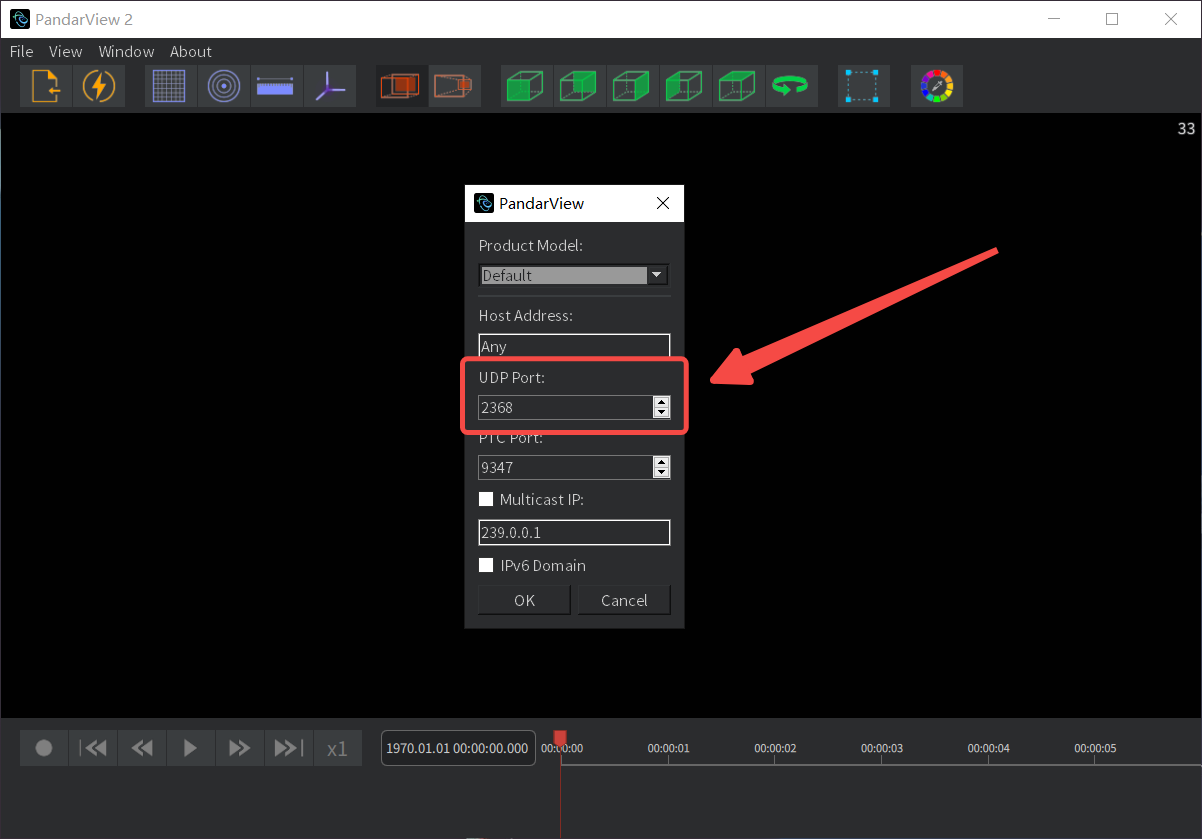
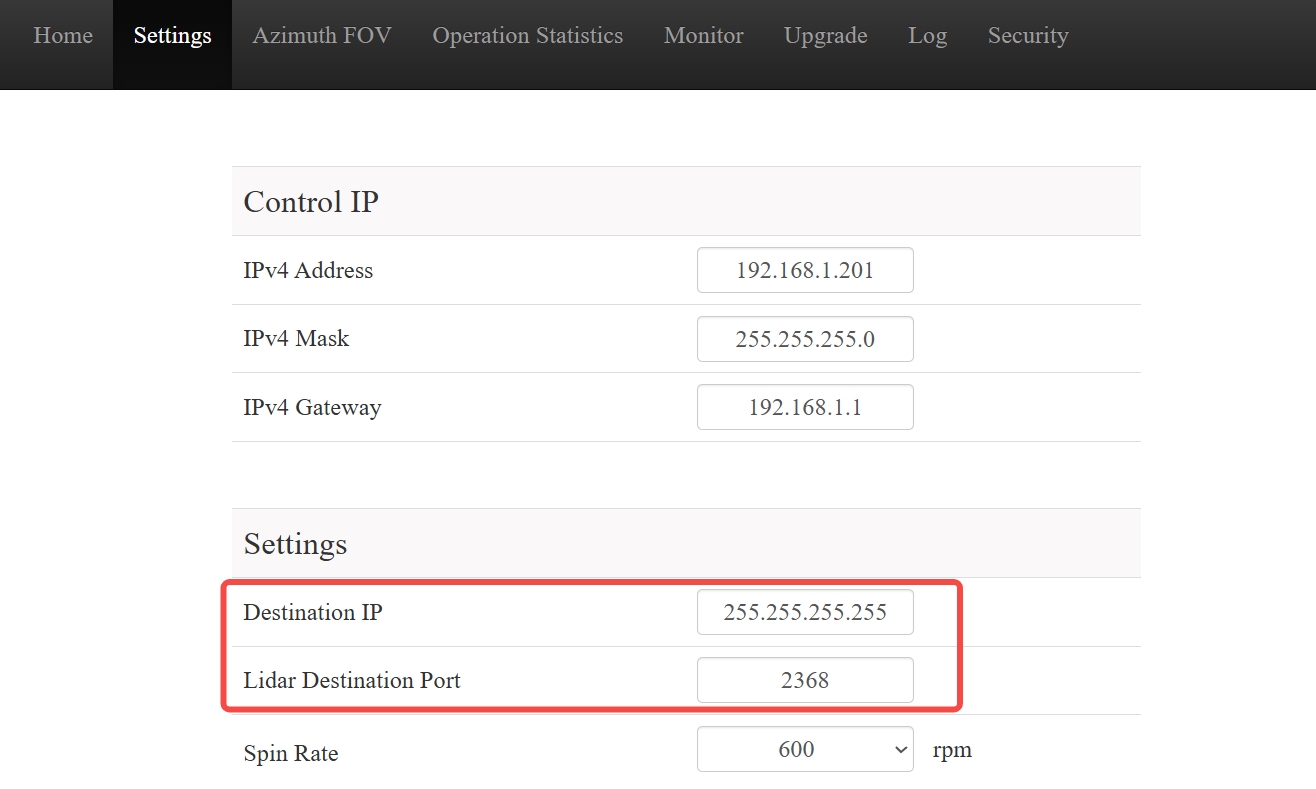
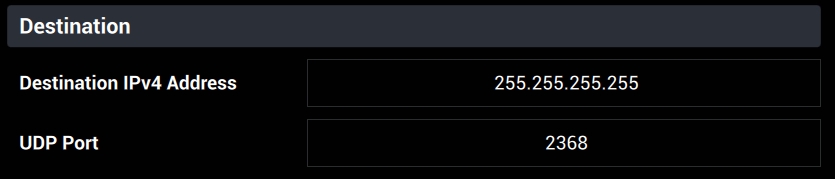
- If the lidar is configured in broadcast mode, change the UDP Port option in the PandarView2 - 'Listen for Data' popout to the actual destination port value (default factory setting is 2368, actual value can be obtained from the lidar control page, as shown below).
Web control page (Pandar series/QT series/XT series)
lidarUtilities interface (OT128 / AT128P)
-
If the lidar is configured in unicast mode, set the host computer's IP address to the lidar's Destination IP (this parameter can be obtained from the lidar control page) and change the UDP Port option in the PandarView2 - 'Listen for Data' popout to the actual destination port value.
-
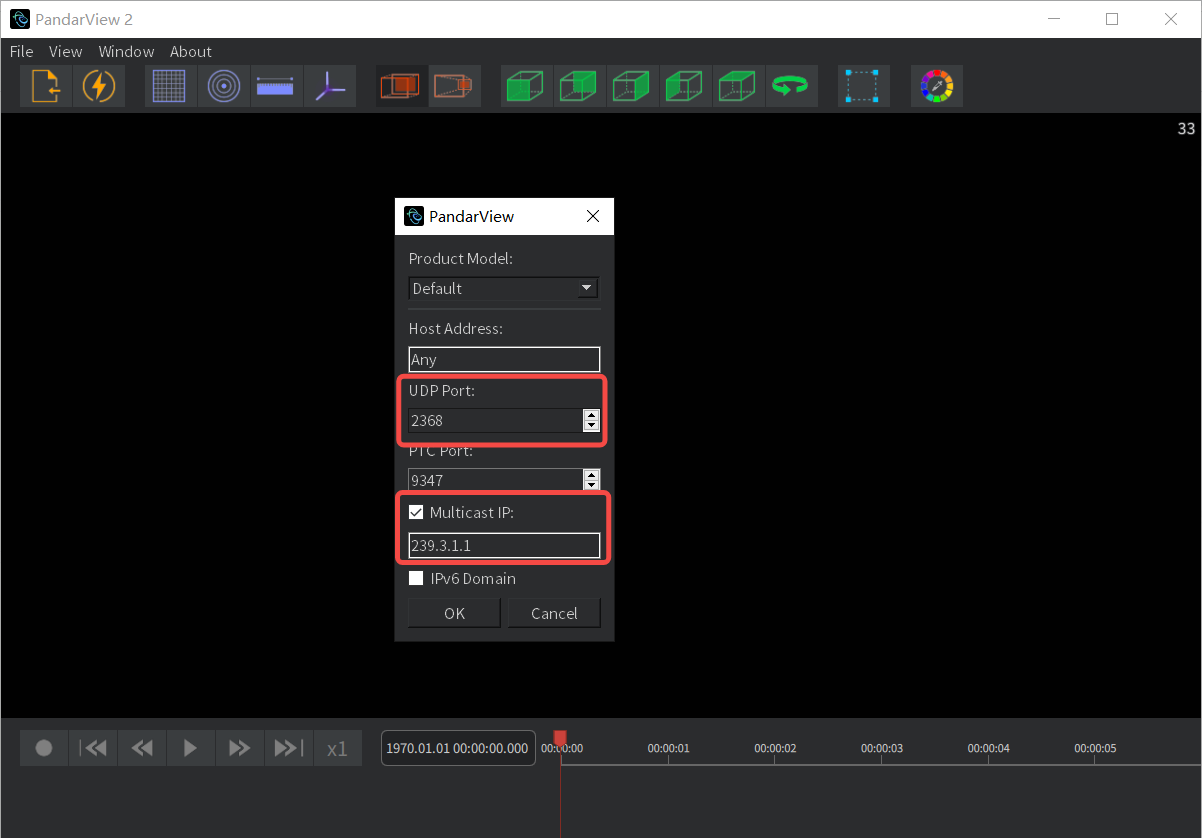
If the lidar is configured in multicast mode, change the UDP Port option in the PandarView2 - 'Listen for Data' popout to the actual destination port value, and select the Multicast IP option in the popout, configuring it to the lidar's Destination IP (this parameter can be obtained from the lidar control page).
Note: For detailed configuration of lidar multicast mode, refer to Configure Ethernet - Multicast.
Note: If the host computer uses an Ethernet-to-USB adapter to connect to the lidar, there is a small probability of point cloud not displaying in PandarView2. It is recommended to use a computer that can directly connect to the lidar via Ethernet cable for point cloud live display.
4.1.2 Incomplete point cloud display
- Check if the lidar lens is clean (if dirty, clean it according to the "Instrument Maintenance" section in the product user manual).
- Log in to the lidar control page via the webpage or LidarUtilities software and verify if the Azimuth FOV parameter settings are correct (if part of the horizontal FOV is disabled).
- Check if lidar's current motor speed is stable at the preset value (check the Motor Speed value displayed in PandarView2). Ensure the lidar is securely mounted to avoid vibrations during operation.
- Check if the host computer's hardware performance and driver configuration meet the requirements (recommended: at least 16GB RAM, support a dedicated graphics card with correct graphics driver version).
- Check if the Ethernet on the host computer is overloaded or if other devices are transmitting data simultaneously, causing network overload and packet loss. It is recommended to connect only one lidar to the host computer, disconnect other devices and power cycle the lidar to check if the issue persists.
4.2 Point Cloud File Playback
4.2.1 Point cloud not displayed
- Ensure the PandarView2 software is the latest version from the official website.
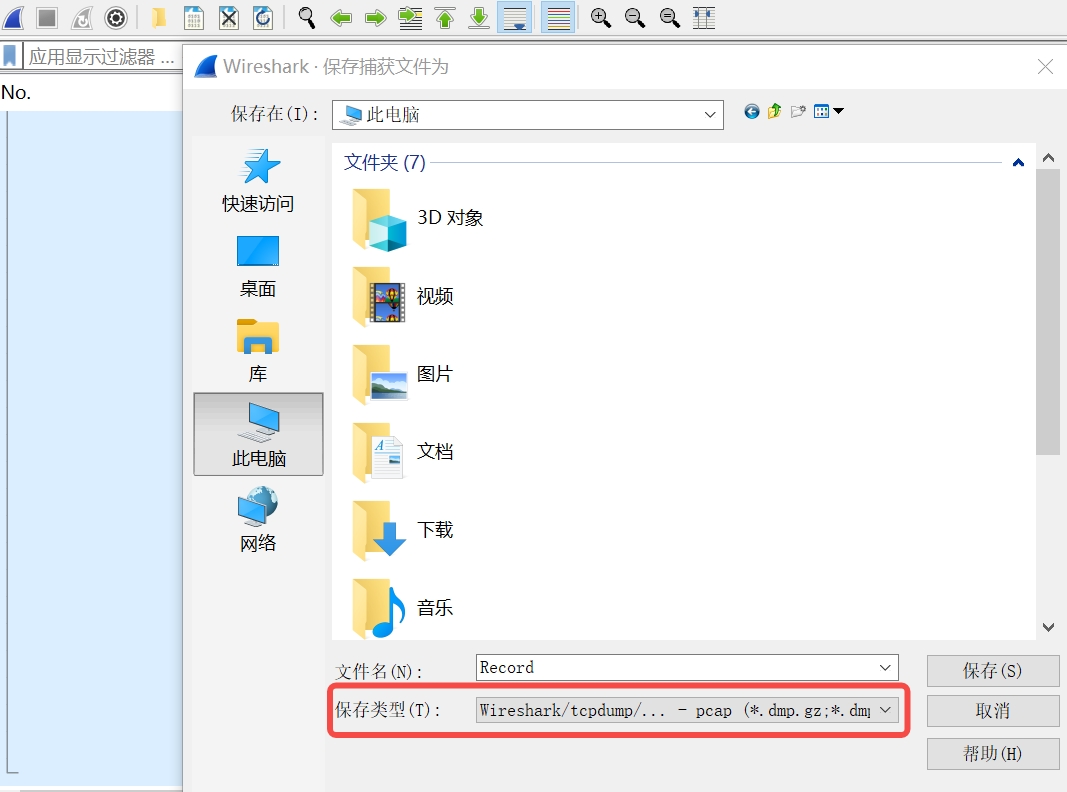
- Check if the point cloud file is in
.pcapformat (Note: When recording point cloud files using Wireshark, the default save format is.pcapng. Users need to manually change it to.pcapformat).
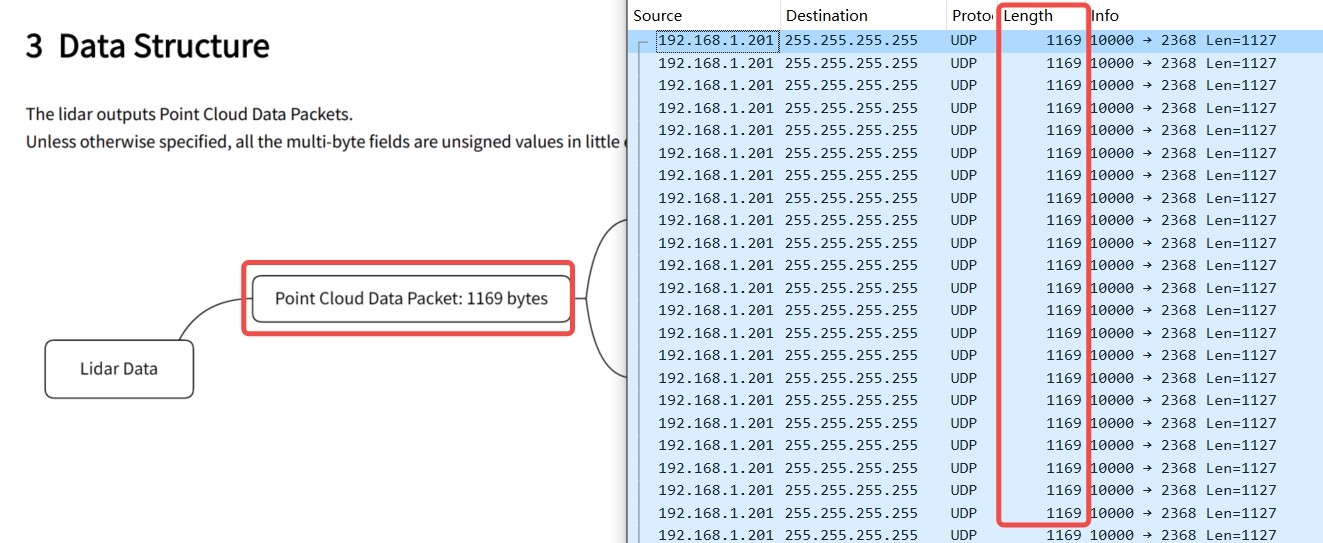
- Check if the UDP packet data length and format in the point cloud
.pcapfile are correct: Use Wireshark to view and compare with the UDP packet length defined in the product user manual (using QT128 as an example, as shown below).
4.2.2 Abnormal point cloud behavior
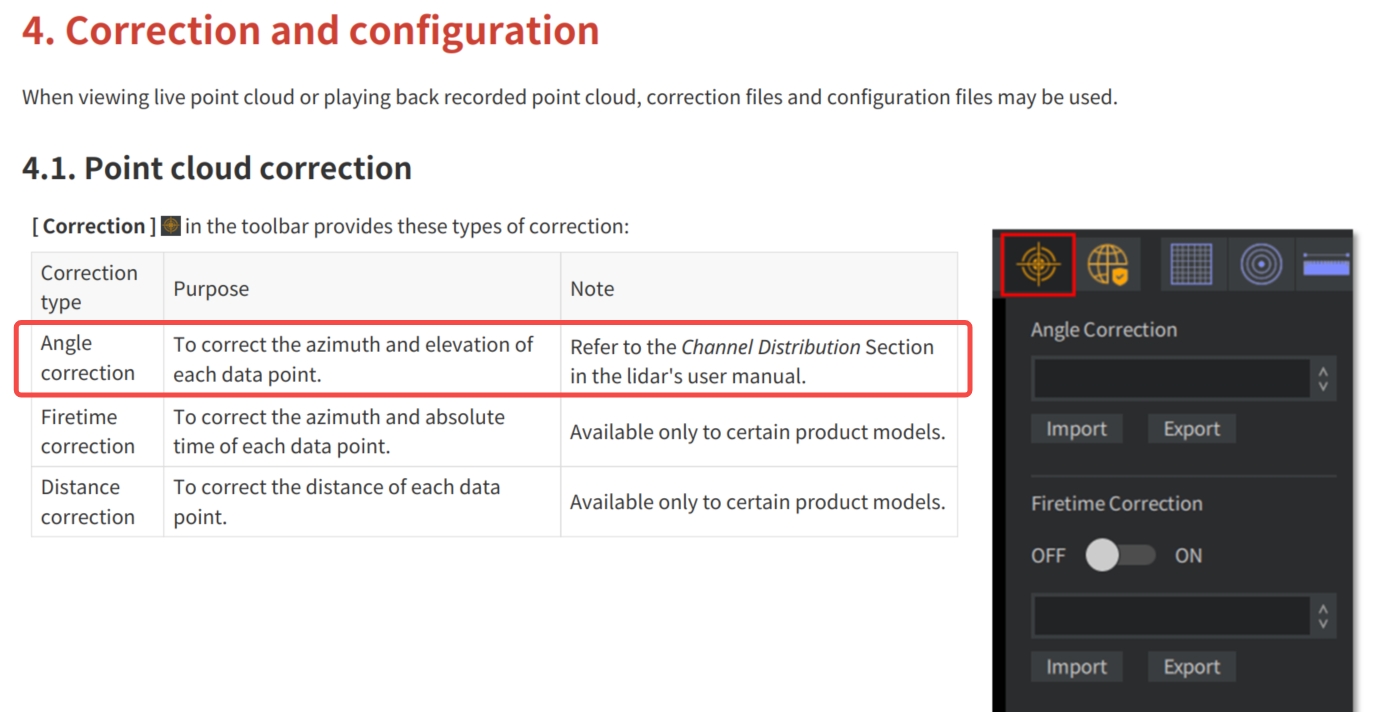
- If the point cloud arrangement is irregular, Check if the angle correction file corresponding to the point cloud file has been properly imported (steps shown as below).
- If the point cloud flickers during playback, check if the
.pcapfile has packet loss (use Wireshark or contact Hesai technical support). If there is no packet loss, verify if the host computer's hardware performance and driver configuration meet the requirements (refer to the troubleshooting methods in the live display section), restart the computer or test with another computer.
If other point cloud display issues persist in PandarView2 after following the above steps, please contact Hesai technical support.