Acquire and Parse IMU Data
1 Overview
Hesai's JT and Pandar series lidars are integrated with built-in IMU device. Users can refer to this document to acquire and parse IMU data.
This document provides a detailed introduction to acquiring and analyzing the built-in IMU data of lidar, as well as methods for viewing IMU data in real-time or offline using tools such as ROS RVIZ and PlotJuggler.
2 Acquire IMU Data
2.1 Connect Lidar to Obtain Data Packets
IMU data from the lidar can be obtained through lidar's Ethernet connection or serial port connection (see How to Configure Ethernet or How to Configure Serial Port for detailed connection methods). The general data acquisition method and steps are as follows:
-
Connecting the Lidar: Power on the lidar and connect it to the computer via an Ethernet cable or a USB-to-serial adapter.
-
Obtaining Lidar Data Packets: Use software such as Wireshark to capture UDP port data packets or use serial monitoring software to capture serial port data.
2.2 IMU Data Format
2.2.1 Ethernet Data Packet Format
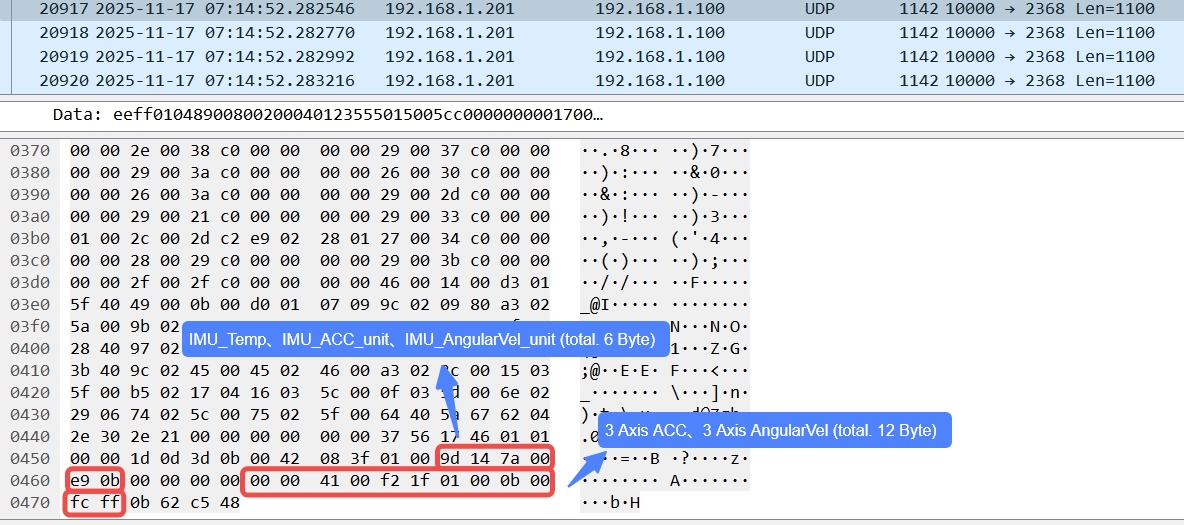
IMU data is included at the end of the UDP data packet. For example, in JT128, the data starts from the 31st byte and spans 22 bytes (including 4 reserved bytes). The specific data structure is shown in the figure below:
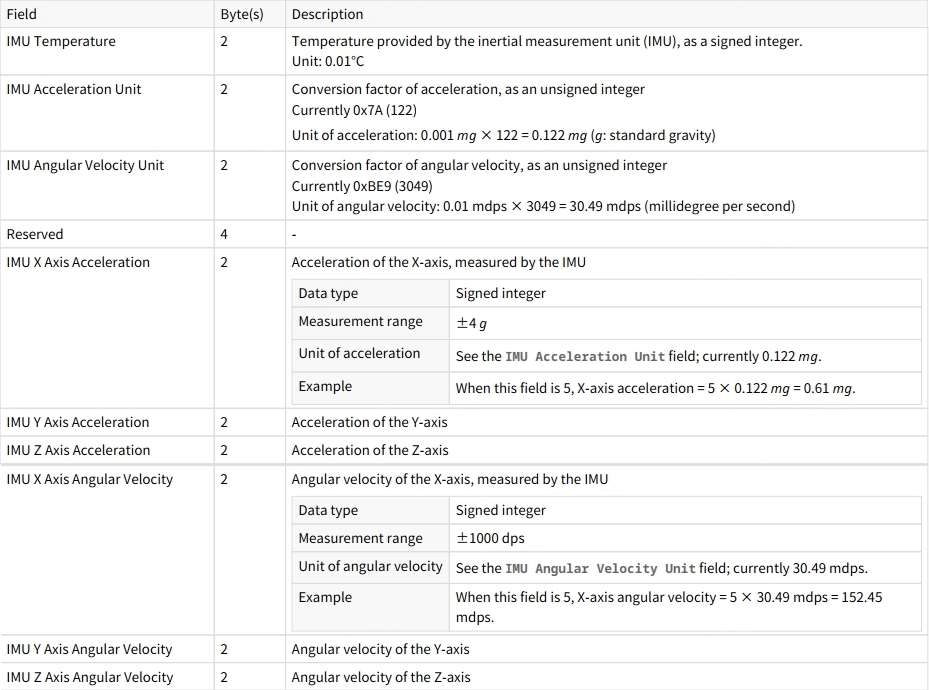
Note: For other lidar models, refer to the respective user manuals for the IMU data structure.
2.2.2 Serial Data Format (JT16)
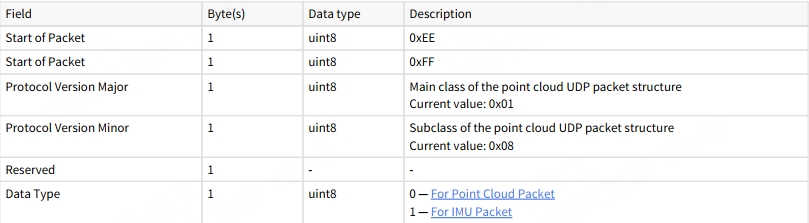
The IMU data packet format consists of 34 bytes, including a 6-byte header, a 10-byte data header, a 14-byte data body, and a 4-byte data tail. The header structure is shown below (IMU data packet, Data Type: 0x01):
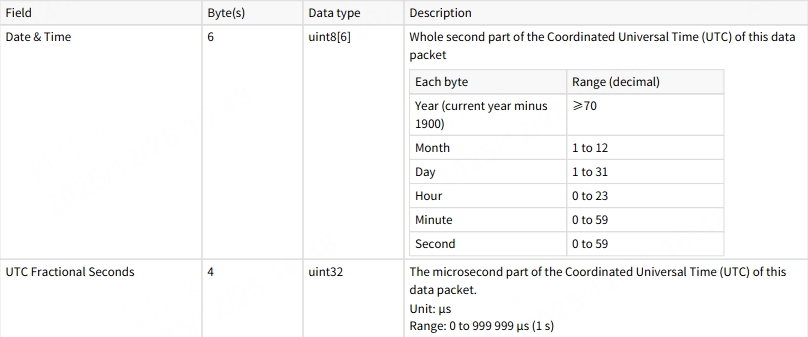
The data header structure is as follows (mainly for timestamps):
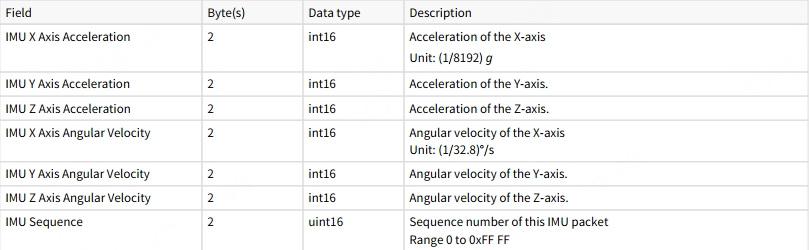
The data body structure is as follows (three-axis acceleration and three-axis angular velocity):
The data tail contains the CRC checksum field.
2.3 Example
For JT128, the specific structure of the IMU data in a PCAP file is shown below:
3 Parse IMU Data
3.1 Parse IMU Data Online with ROS
Hesai's official ROS/SDK supports IMU data parsing. Users can connect the lidar and run the launch/py file to publish the lidar IMU data topic. The specific steps are as follows:
ROS1
- Run the launch file:
roslaunch hesai_ros_driver start.launch
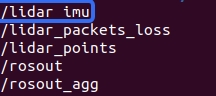
- Use the following command to view the IMU data topic, as shown below:
rostopic list
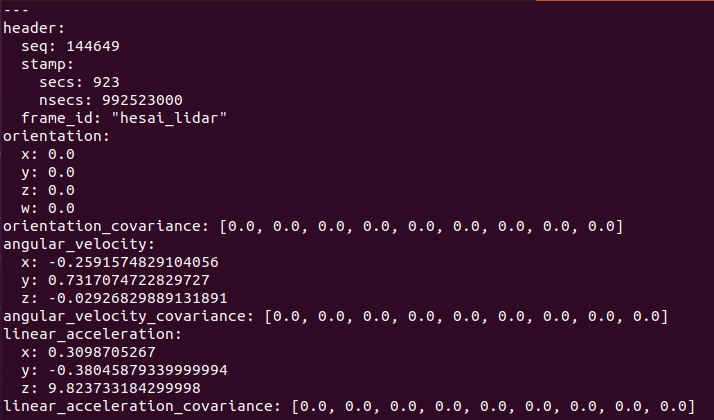
- Use the following command to view real-time IMU data. The returned result is shown below:
rostopic echo /lidar/imu
ROS2
- Run the py file:
ros2 launch hesai_ros_driver start.py
- Use the following command to view the IMU data topic. The result is the same as in ROS1:
ros2 topic list
- Use the following command to view real-time IMU data. The result is the same as in ROS1:
ros2 topic echo /lidar/imu
3.2 Parse IMU Data Offline with ROS
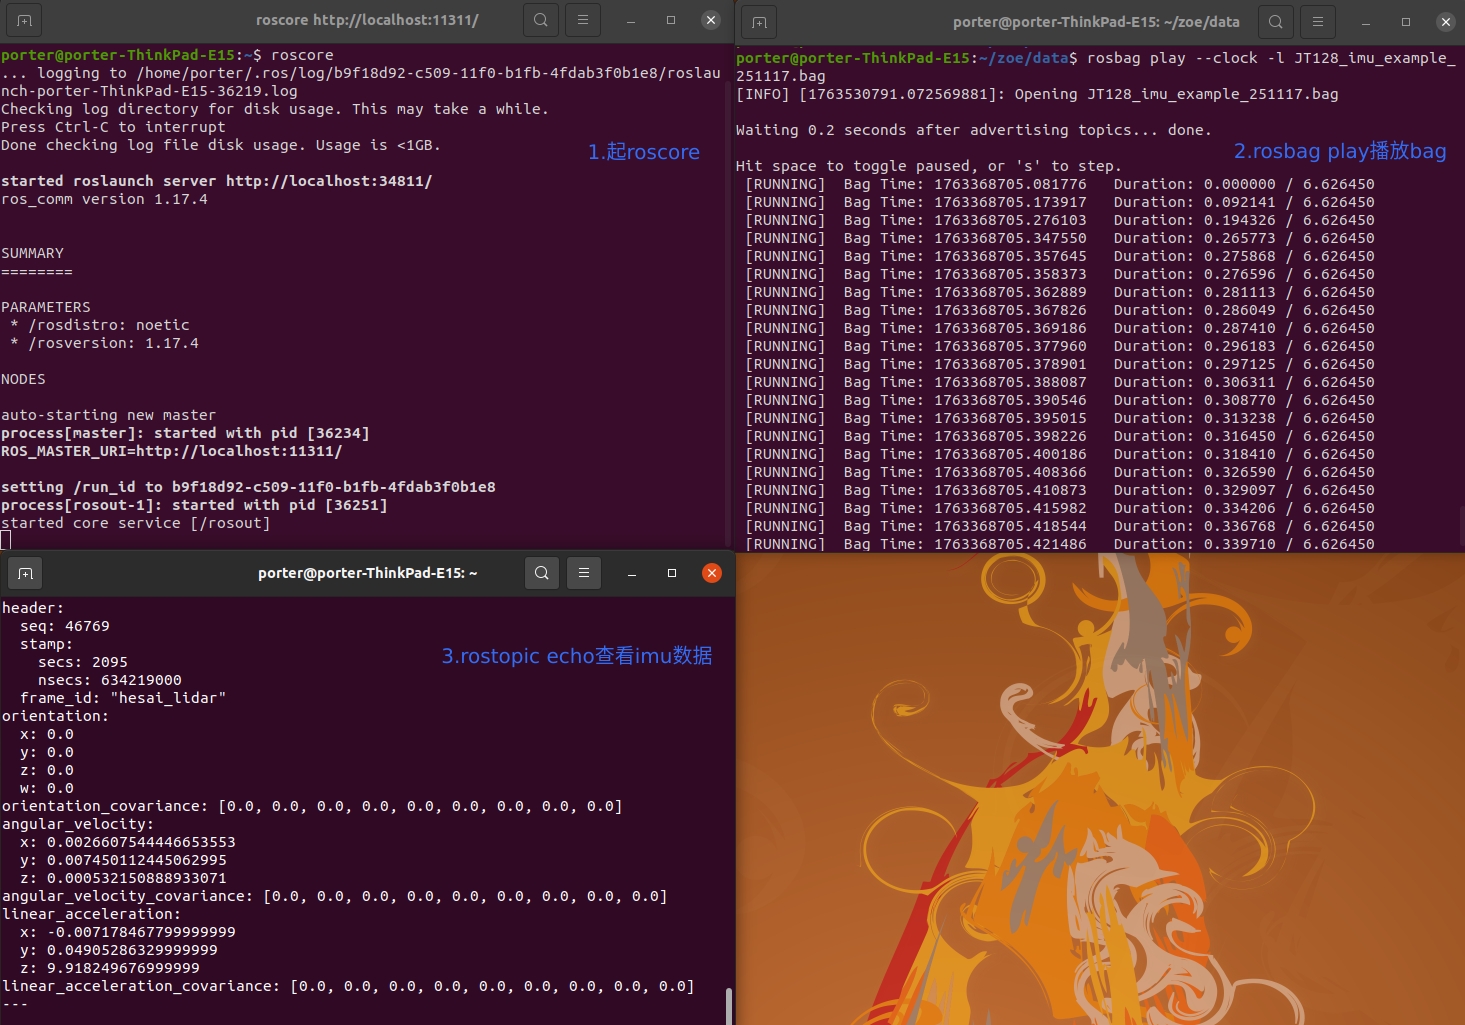
Raw IMU data saved in PCAP files can be parsed using the SDK and directly replayed to view IMU data saved in ROS bags.
- Example: replay the ROS bag of JT128 in ROS1 to view IMU data, as shown below:
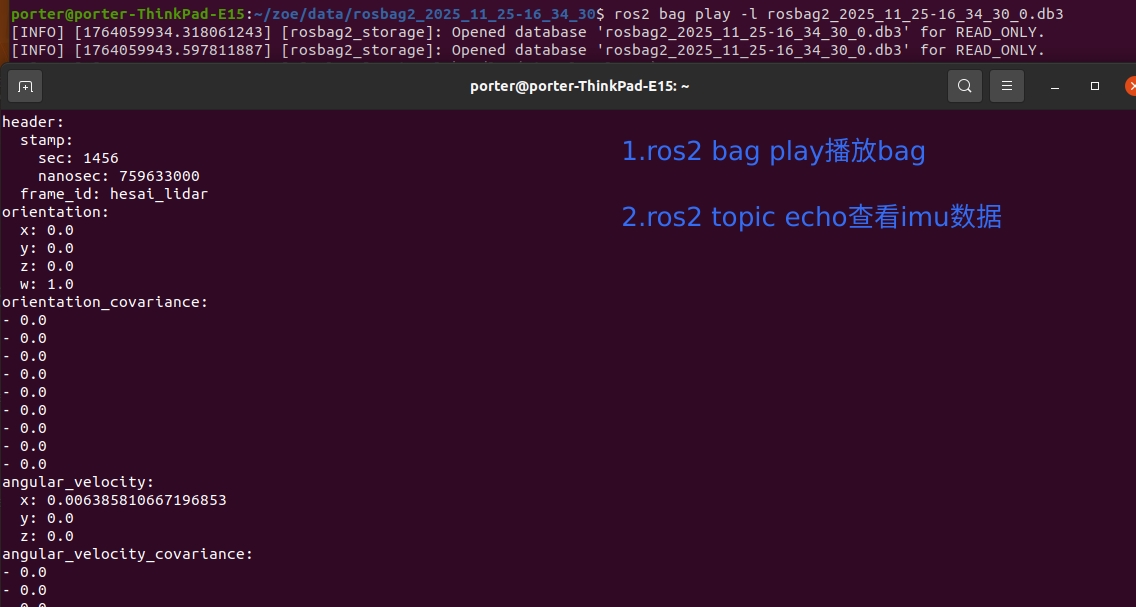
- Example: replay the ROS bag of JT128 in ROS2 to view IMU data, as shown below:
3.3 View IMU Data in Real-Time or Offline with RVIZ/PlotJuggler
- ROS provides a 3D visualization tool, RVIZ, which allows users to load IMU display elements and view the IMU's orientation in real-time or during offline playback.
- PlotJuggler is a Qt-based data visualization tool that is particularly advantageous for displaying time-series data such as velocity and pose. It allows users to view the changes in three-axis acceleration and three-axis angular velocity over time in real-time or during offline playback.
3.3.1 RVIZ Display
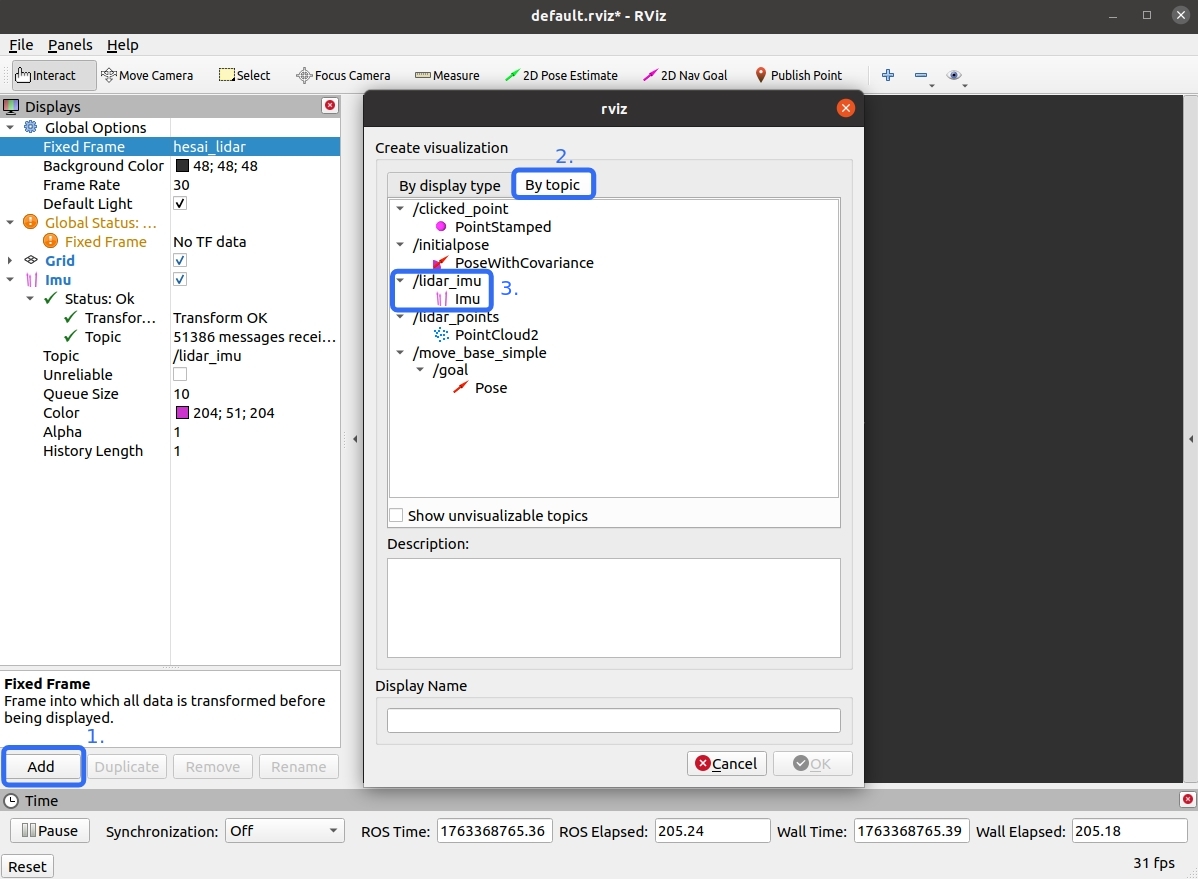
- Click Add button and add the IMU display element by topic, as shown below:
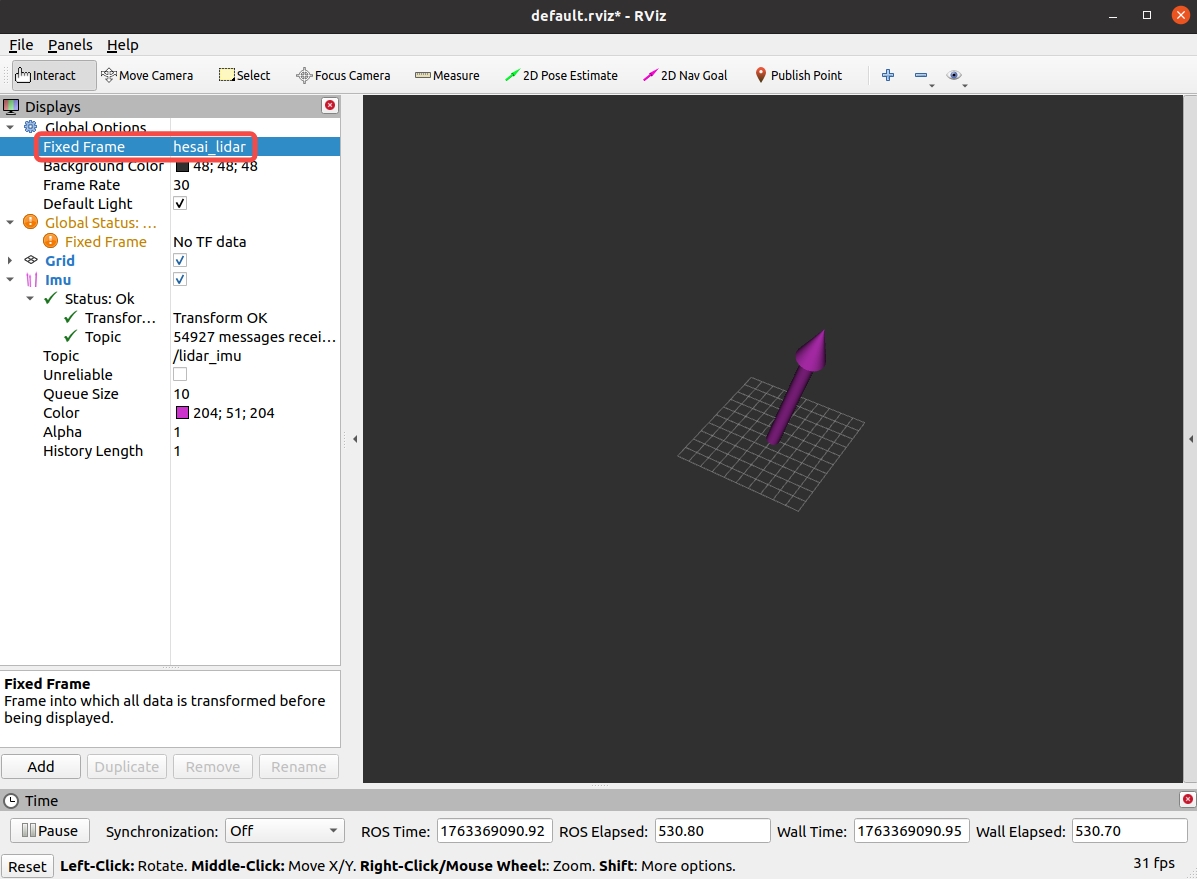
- Set Fixed Frame to
hesai_lidar. The final display is shown below:
3.3.2 PlotJuggler Display
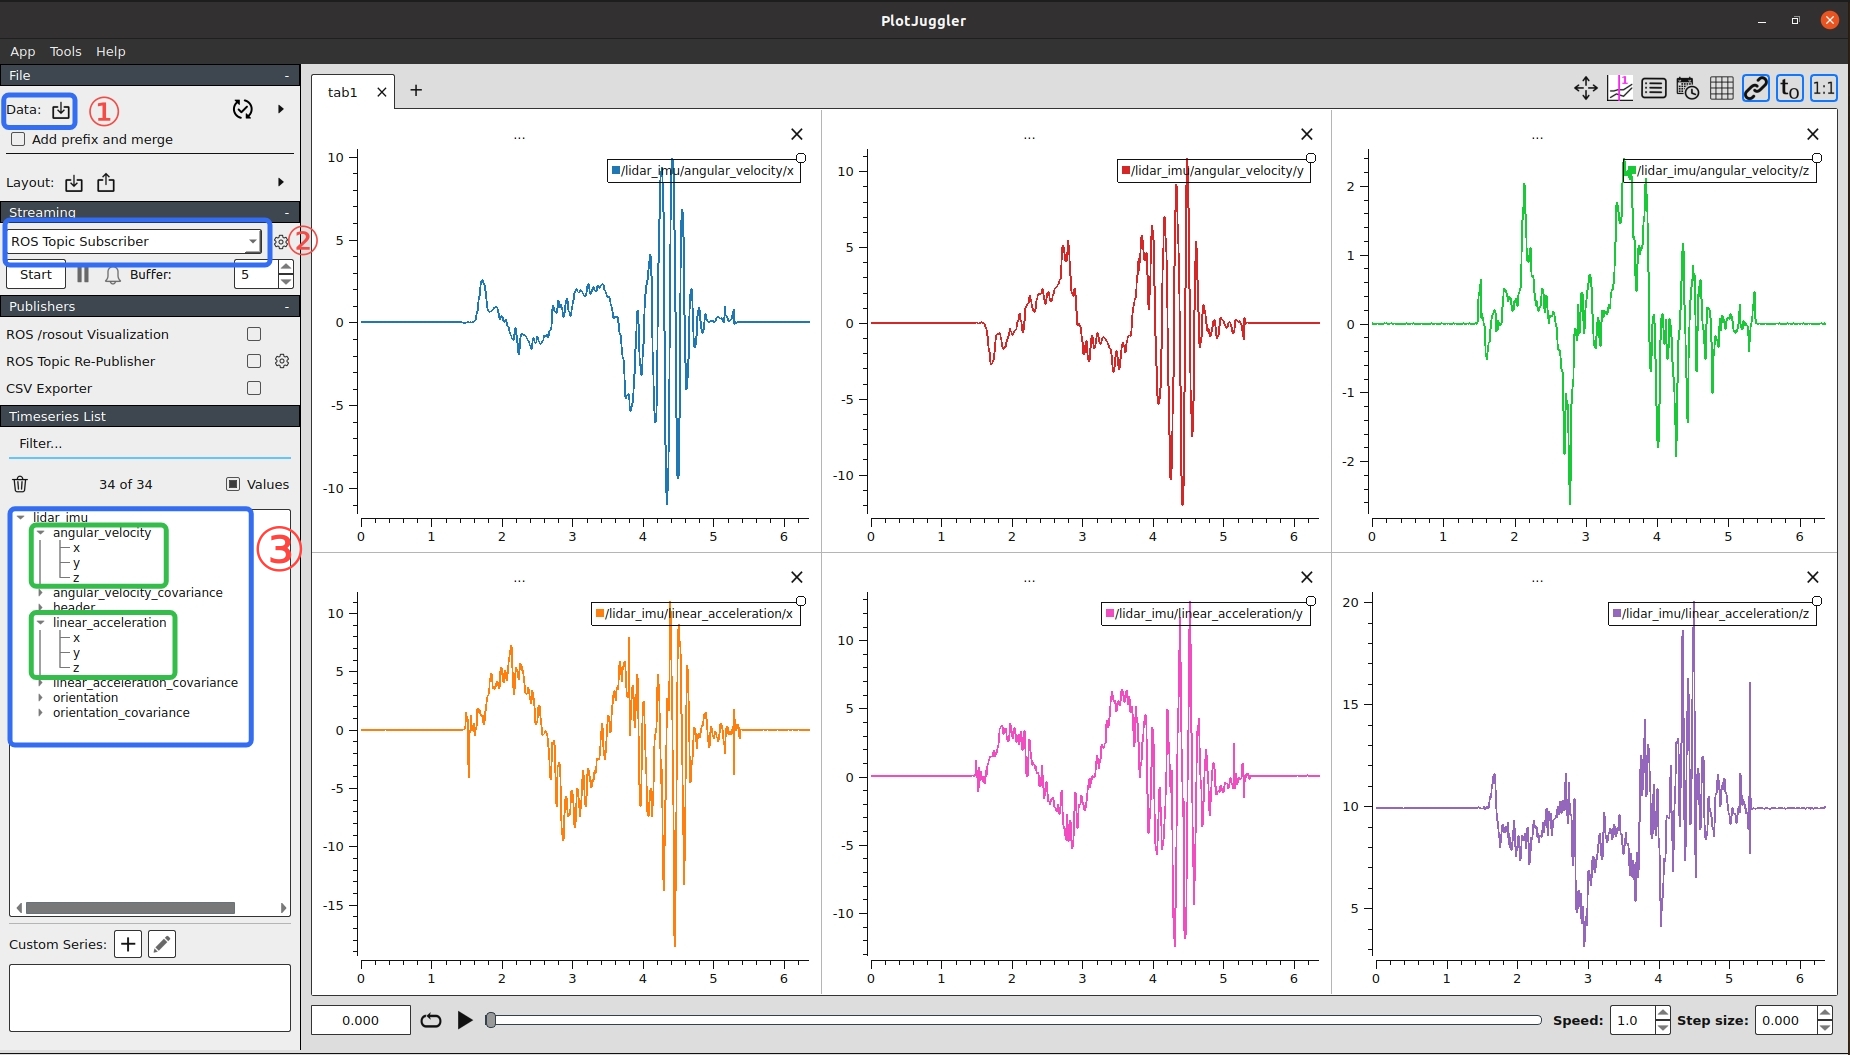
- Load the recorded data file, select the IMU-related topic, or listen to the IMU-related topic from the real-time stream.
- Drag the IMU data to the chart display area on the right to clearly display the changes in IMU data over time.
- The display result is shown below:
Find it useful?